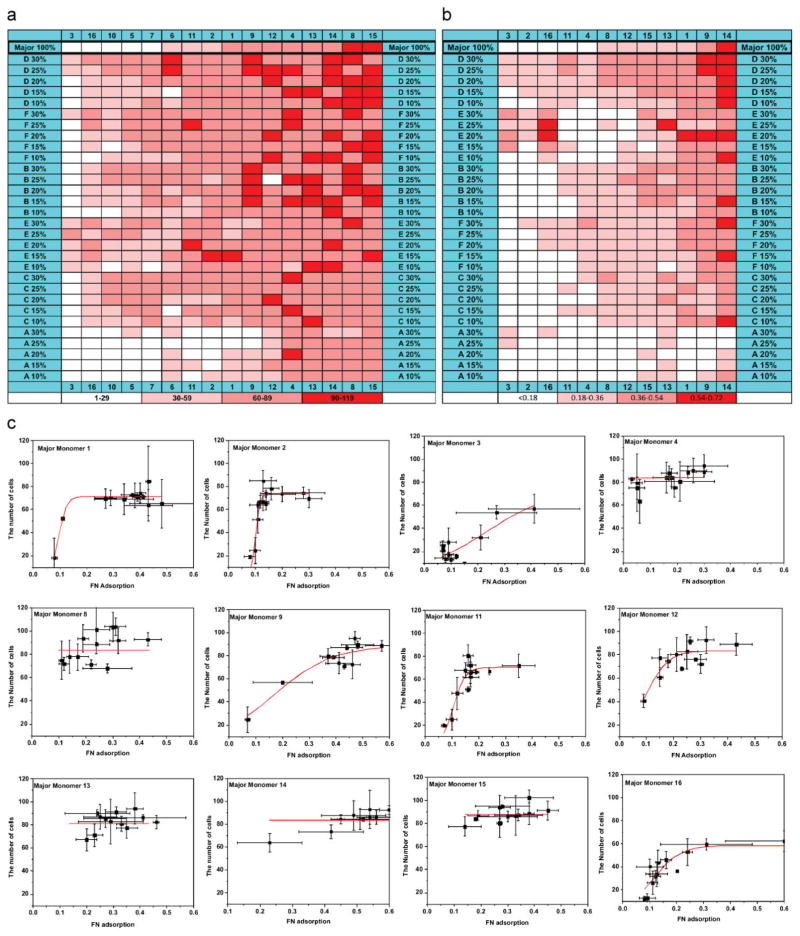
Figure 2.
a) Map of the relationship between cell attachment and polymer composition. Cell number per spot was grouped into four catagories 1–29, 30–59, 60–89, and 90–119 per spot. Cell numbers are mapped as a function of polymer composition. b) A map of the relationship between Fn adsorption and polymer composition, the major monomer 5, 6, 7, and 10 are excluded due to autofluorescence from the polymer spots. c) hEB cell attachment as a function of the Fn adsorption on the polymer array; the data has been grouped according to their major monomers.

