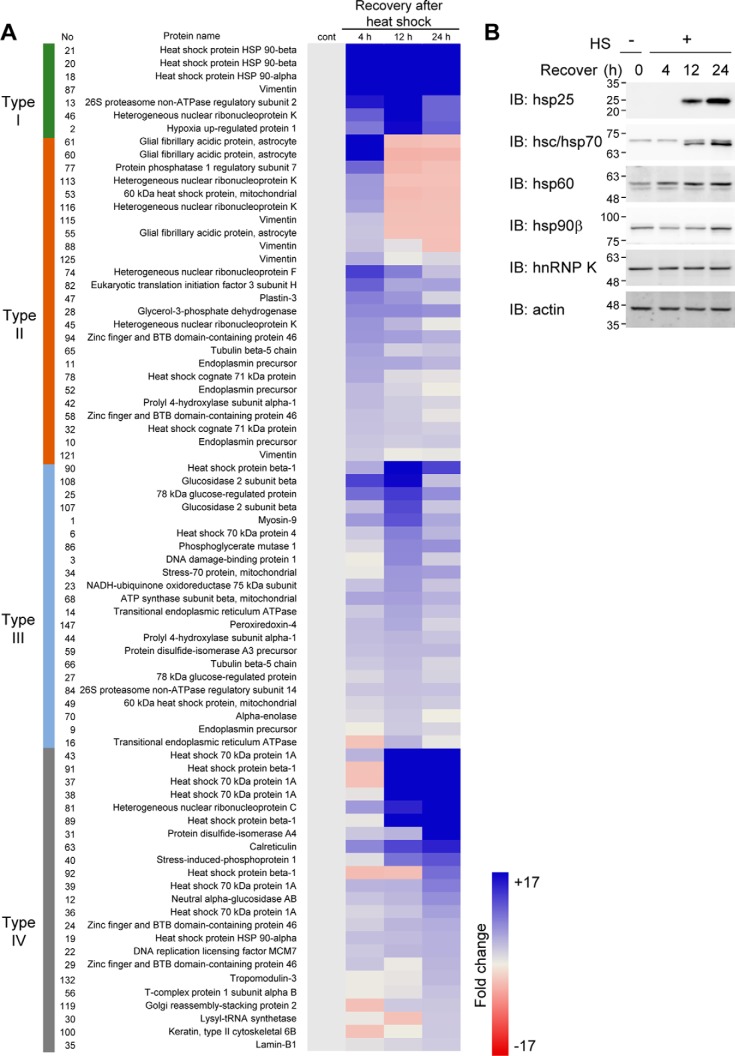
Figure 1.
Proteomic analysis of heat shock–induced cellular proteome changes. A, RIF-1 cells were heat shock (45 °C, 30 min) treated and recovered for 4, 12, and 24 h. Differentially appearing proteins in 2D-PAGE gels were identified by MS and quantified by image analysis. Proteins more than 1.3-fold up-regulated were analyzed and grouped based on their fold induction kinetics. B, cells were analyzed by Western blot analysis using anti-hsp25, -hsc/hsp70, -hsp60, -hsp90β, and -hnRNP K antibodies and actin antibody for loading control. Molecular mass markers (kDa) are shown alongside Western blot images. IB, immunoblot.

