Figure 2.
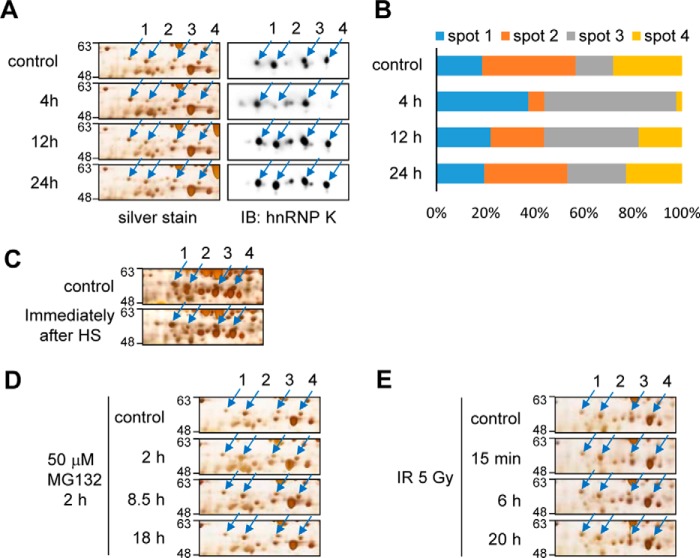
Heat shock changes hnRNP K spot positions on 2D-PAGE gels. A and B, RIF-1 cells were heat shock–treated (45 °C, 30 min) and recovered for 4, 12, and 24 h. The cells were analyzed by 2D-PAGE and visualized by silver staining and Western blot analysis using anti-hnRNP K antibody (A). Western blot results of spots 1–4 in A were quantified and represented by bar graphs (B). C, RIF-1 cells were heat shock–treated (45 °C, 30 min) and harvested immediately after heat shock. The cells were analyzed by 2D-PAGE and visualized by silver staining. D, RIF-1 cells were 50 μm MG132-treated for 2 h and recovered for 2, 8.5, and 18 h. The cells were analyzed by 2D-PAGE and visualized by silver staining. E, RIF-1 cells were treated with 5-gray ionizing radiation and recovered for 15 min, 6 h, and 20 h. The cells were analyzed by 2D-PAGE and visualized by silver staining. Spots 1–4 indicate hnRNP K subpopulations. cont, control; IB, immunoblot; IR, ionizing radiation.

