
Figure 3.
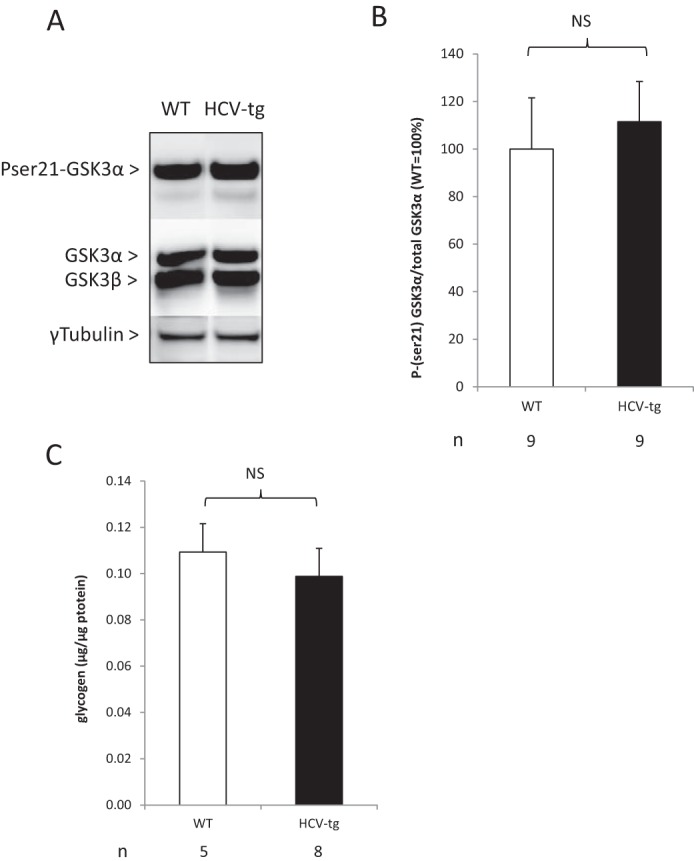
A, representative examples of Ser(P)21 GSK3α phosphorylation status in liver extracts from HCV-transgenic (HCV-tg) and control WT mice by Western blot analysis, normalized to total GSK3 expression (representative animals). B, average Ser(P)21 GSK3α protein levels in liver extracts from HCV-tg and control WT mice by Western blot analysis, normalized to total GSK3 expression. NS, not significant. C, total liver glycogen content in HCV-tg and control WT mice, normalized to total liver protein weight.