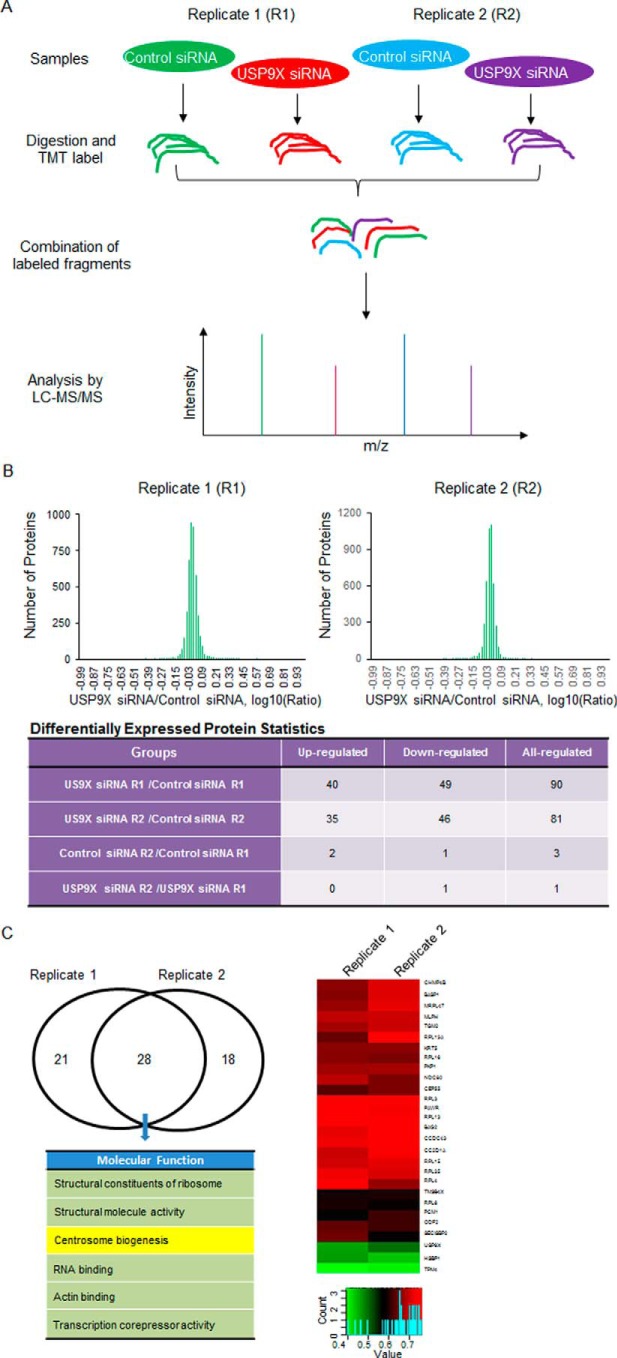
Figure 1.
TMT labeling assay analysis of USP9X-regulated genes. A, TMT labeling assay-based mass spectrometry analysis of USP9X-regulated protein expression. A flow chart describing the protocol to quantify USP9X depletion-associated protein expression changes from biological duplicate experiments is shown. B, summary of the TMT labeling assay results. By modeling the normal distribution of the protein ratios, a confidence interval of 95% and cutoff values of ≦0.770 and ≧1.3 were applied to identify the proteins with significant down- or up-regulation after USP9X depletion. C, functional analysis and clusterization of down-regulated proteins associated with USP9X depletion from overlapping hits in duplicate experiments. A color key and histogram of the relative expression level for 28 down-regulated proteins are shown.

