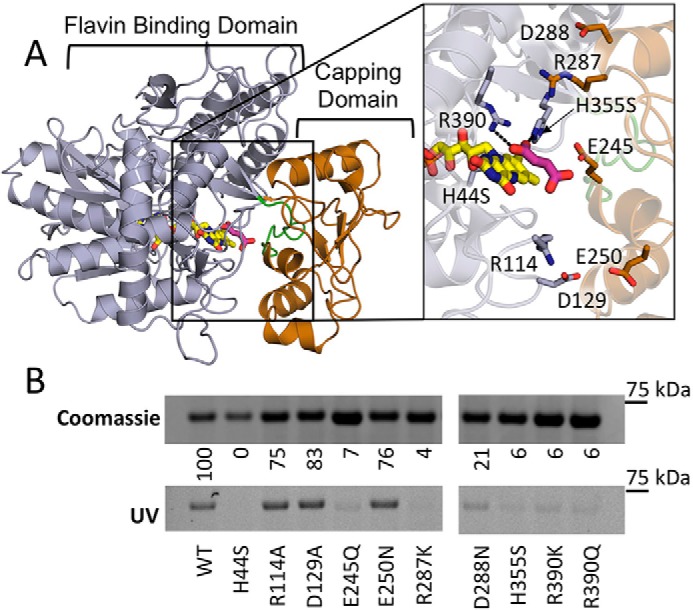
Figure 3.

Covalent flavinylation of QFR mutants. A, location of substitutions in the FrdA subunit of QFR on the flavin-binding (gray) and -capping domains (copper) (PDB entry 3P4P (38)). Flavin (yellow) and fumarate (pink) ligands are modeled and the active site loop flanking FrdA245E is colored green (residues 234–244 in QFR). Zoomed window shows a close up of the location of the residues that were altered to evaluate their effect on covalent flavinyation. They are colored according to their location on either the flavin-binding or -capping domain. B, quantitation of covalent FAD levels in wild-type and variant QFR complexes. Coomassie-stained SDS-PAGE gels are normalized to the total amount of protein to assess differences in expression levels of variant QFR complexes. The same gel was illuminated with UV light to measure covalent flavinylation by flavin fluorescence. The ratio between the Coomassie signal and the flavin fluorescence was quantified. Wild-type covalent flavinylation was set to 100%, whereas QFR-FrdAH44 was set to 0%, and these were used as standards to quantify the percentage of covalent FAD in the remaining variants.
