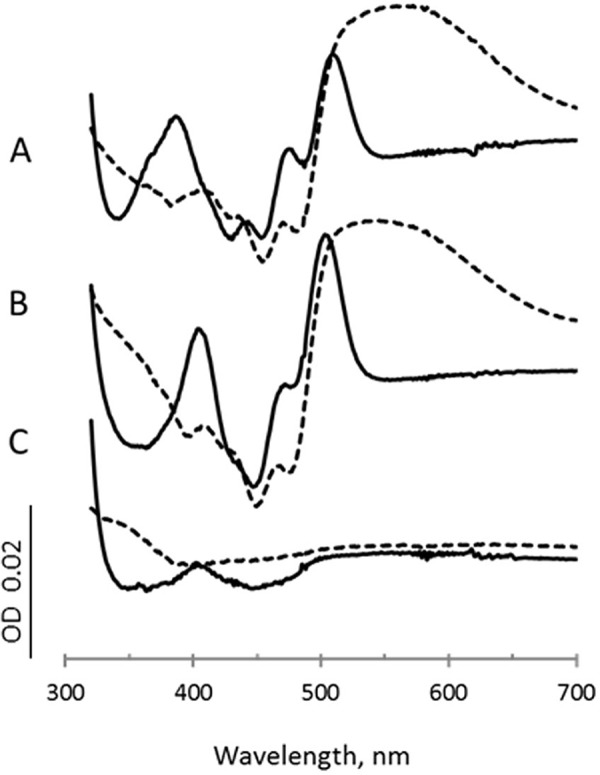
Figure 4.

Dicarboxylate scans. Spectra are the difference between the spectrum of the enzyme after addition of each ligand minus the spectrum of the oxidized enzyme. Difference spectra for fumarate (10 mm) is shown as solid lines, and difference spectra for oxaloacetate (0.2 mm) are shown as dashed lines. A, wild-type QFR; B, QFR-FrdAH44S; C, QFR-FrdAE245Q.
