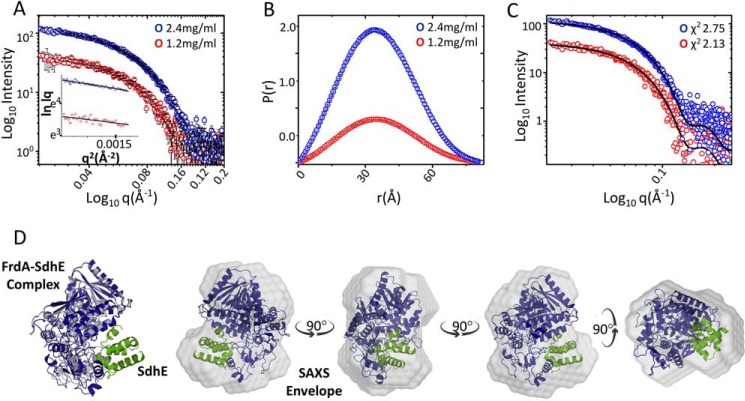
Figure 8.
SAXS of the cross-linked FrdA-SdhE-R9pBpF complex. A, intensity profiles in log scale of the cross-linked FrdA-SdhE complex acquired at protein concentrations of 1.2 (red) and 2.4 mg/ml (blue). The insets show the linear fit to the Guinier region of the respective protein concentrations. B, P(r) plot depicting the frequency distribution of interatomic vectors in the predominant scattering species after indirect Fourier transformation of the SAXS data provided an Rg and Dmax of 27.25 ± 0.32, 28.02 ± 0.13, and 82.83 and 86.81 Å, respectively, at lower and higher protein concentration. C, comparison of theoretical scattering curve (black line) of the computational model of the cross-linked protein with experimental scattering curves at different protein concentrations give χ2 values of 2.13 and 2.75, respectively. D, conceptual model of FrdA (blue) and SdhE (green) complex superimposed on wild-type FrdA (gray, PDB entry 3P4P (38)) and the SAXS envelope by automated alignment of inertial axes. Rotating views of the FrdA-SdhE-R8BpF model docked into the SAXS envelope.

