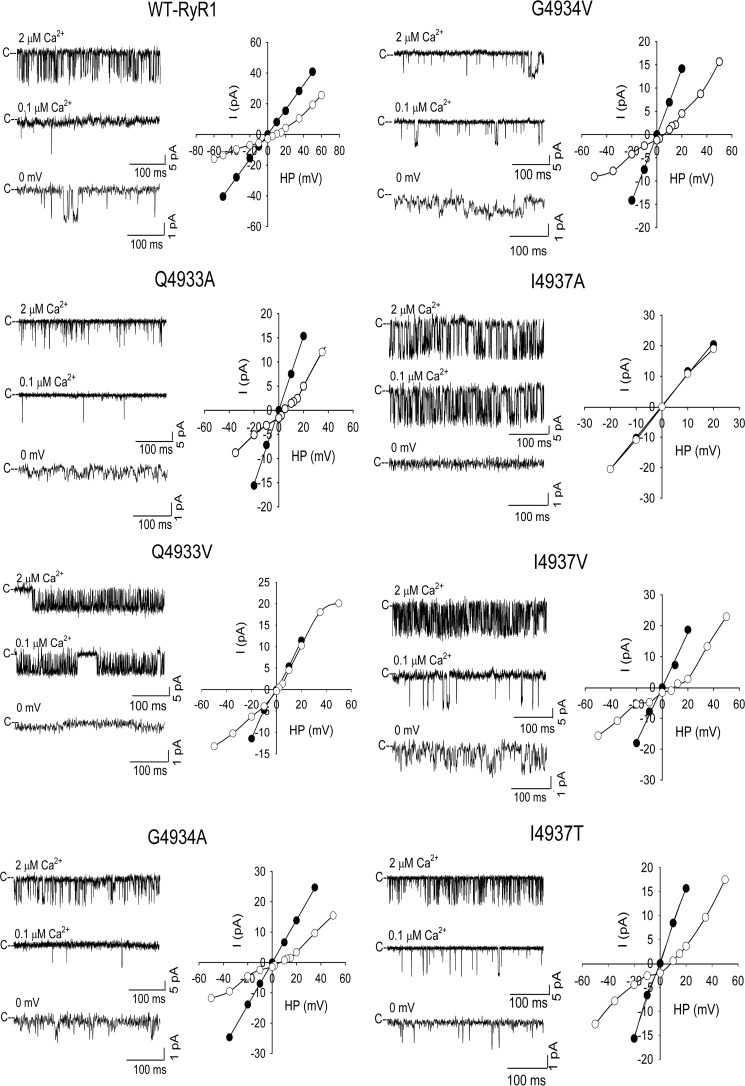
Figure 7.
Single channel recordings of WT and mutant channels. Left panels, shown are representative single channel currents at −20 mV (upper and middle traces) or 0 mV (bottom traces) as downward deflections from the closed states (c–) in symmetrical 250 mm KCl with 2 μm Ca2+ in the cis chamber (upper traces) and following the subsequent addition of EGTA to yield free Ca2+ of 0.1 μm (middle traces) or the addition of 10 mm Ca2+ to the trans chamber (bottom traces). Right panels, representative current–voltage relationships in 250 mm symmetrical KCl (●) and after the addition of 10 mm trans Ca2+ (○). Averaged Po values and ion permeation properties are summarized in Table 1.

