
Figure 8.
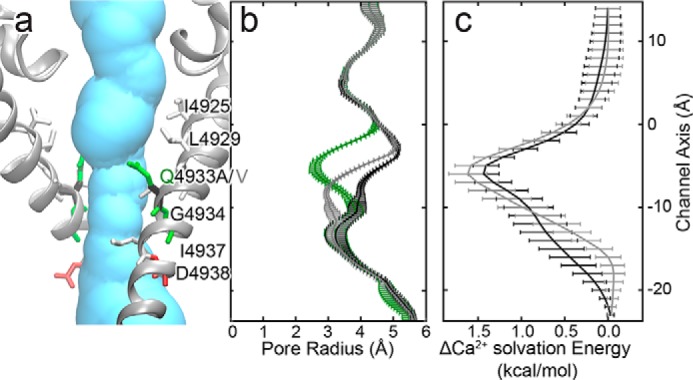
The Q4933A and Q4933V mutations increase both the minimum pore radius and Ca2+ solvation energy. a, structure of the open-channel pore surrounding position 4933. Pore lining residues are shown as sticks and colored according to residue type: red, acidic; green, polar; and white, aliphatic. Gln-4933, Q4933A, and Q4933V are colored green, black, and gray, respectively. b, RyR1 open-channel pore profiles for wild-type (green) and Q4933A (black), and Q4933V (gray) models. The pore profiles are the mean ± S.E. calculated over five structures sampled evenly over the last 20 ns of molecular dynamics simulation. c, mean change in Ca2+ solvation energies between mutant and wild-type RyR1 for Q4933A (black) and Q4933V (gray) mutations calculated over the same five structures from b. Error bars represent the 95% confidence interval for the difference between the means.