
Figure 2.
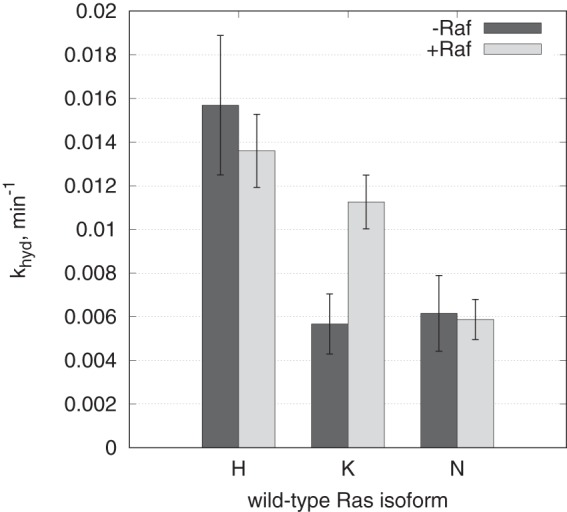
Single-turnover GTP hydrolysis experiments for H-Ras, K-Ras, and N-Ras conducted in the absence or in the presence of Raf-RBD. The vertical axis represents the single-turnover rate constant khyd: the dark gray and light gray bars correspond to the best-fit values from global fit of combined triplicate experiments in the absence of Raf-RBD and presence of Raf-RBD, respectively. The error bars are calculated as the “low” and “high” limits of nonsymmetrical confidence intervals at 68% confidence level. See supplemental data for the raw data and individual progress curves.