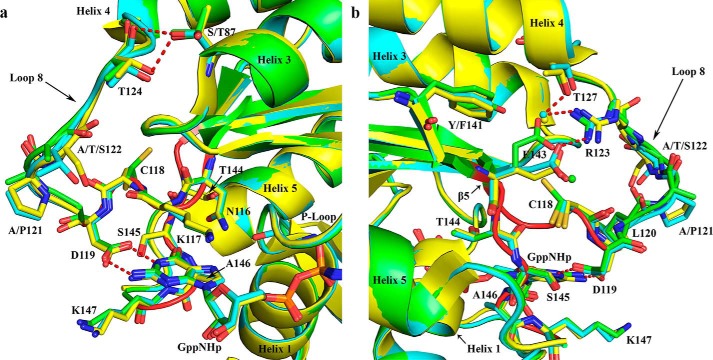
Figure 6.
Superposition of H-Ras (green), K-Ras (yellow), and N-Ras (cyan) showing areas associated with the nucleotide-binding pocket with an impact on switch I. Water molecules are shown in the color of their respective structures. Selected H-bonding interactions are shown as red dashed lines. The NKXD and EXSAK motifs are highlighted in red, maintaining the ribbon diagram over the associated residues shown as sticks in the color of the particular isoforms. a, residue 87 (Thr in H-Ras and K-Ras and Ser in N-Ras) interaction with Thr-124 in loop 8 and the conserved guanine-binding residues. b, interaction between Arg-123 (loop 8) and Glu-143 (EXSAK motif), showing the effect of residues 141 (Tyr in H-Ras and Phe in K-Ras and N-Ras) on the salt bridge.

