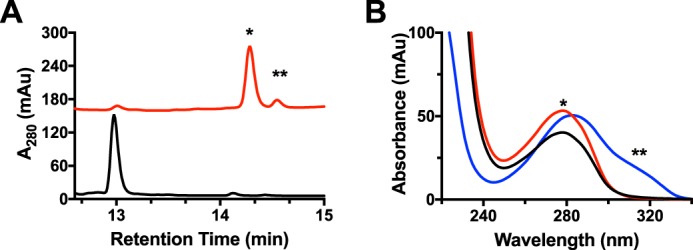
Figure 2.

MftC catalyzed the formation of two MftA products annotated as MftA* and MftA**. A, HPLC analysis of the reactions shows the conversion of MftA M1W (black) to MftA* (14.3 min) and MftA** (14.5 min). Analyses were carried out on a C4 HPLC column. B, the absorbance spectra of MftA M1W (black) and MftA* (red) are similar, whereas the absorbance spectra for MftA** (blue) indicates the appearance of a new spectral feature from 300–325 nm and a red-shift in peak maximum. mAu, milliabsorbance units. *, MftA*; **, MftA**.
