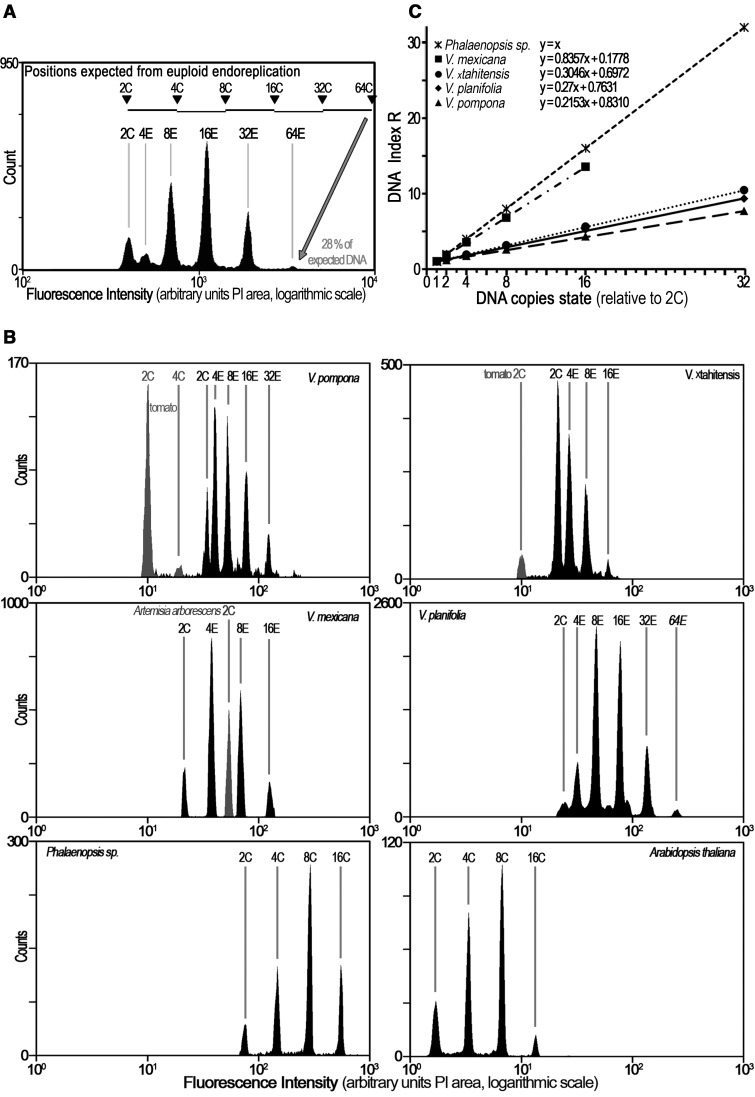
Fig. 1.—
Partial endoreplication in four Vanilla spp. contrasting with euploid endoreplication. (A) DNA histogram of young leafy apex from Vanilla planifolia. Note the 2C nuclear population and endoreplicated nuclear populations 4E, 8E, 16E, 32E, and 64E from young leafy apex of an in vitro Vanilla planifolia plant. (B) DNA histograms from V. pompona, V. ×tahitensis; V. mexicana; V. planifolia, and Phalaenopsis sp. (tomato or Artemisia arborescens as internal standard.) The peaks correspond to 2C, 4E, 8E, 16E, 32E, and 64E. For Phalaenopsis sp. these are simply 2C–64C. (C) Plotting DNA index R as a function of DNA copies state allows determination of the endoreplicated proportion P. Regression lines for each species are shown, with their respective functions and correlation coefficients R2 (in all cases >0.999). The estimated function of each graph is y = P x + F, where P is the endoreplicated proportion, and F the fixed proportion of DNA. Each point is the mean of at least 30 measurements. Note that P value varies between Vanilla species, being the lowest in Vanilla pompona.

