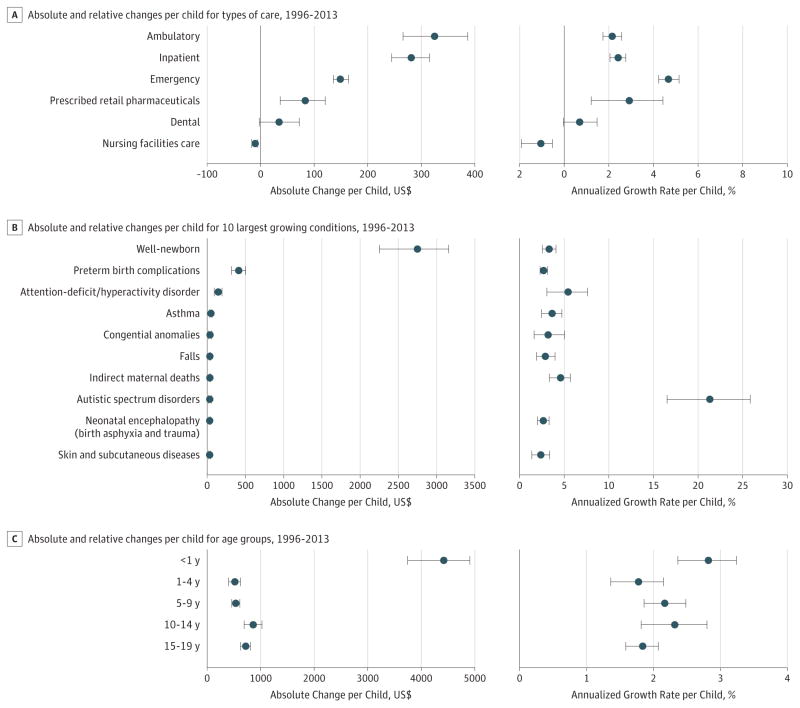
Figure 4. Changes in Spending per Child on Personal Health Care in the United States by Condition From 1996 to 2013.
Each panel reports the absolute change in spending (left) reported using inflation-adjusted 2015 US dollars and the annualized rate of change in spending (right) reported as an annualized growth rate. For all panels and axes, change is the difference in spending between 1996 and 2013. A, Changes in spending for all 7 types of care. Emergency care excludes emergency visits that resulted in an inpatient stay admission. Inpatient care includes spending in emergency departments for patients that transferred to inpatient care and includes pharmaceuticals provided to these patients. Ambulatory care includes urgent care clinics and pharmaceuticals provided as part of a visit. B, Changes for the 10 conditions with the greatest absolute increases in spending. C, Changes in spending for the 5 age groups. Error bars indicate uncertainty intervals.

