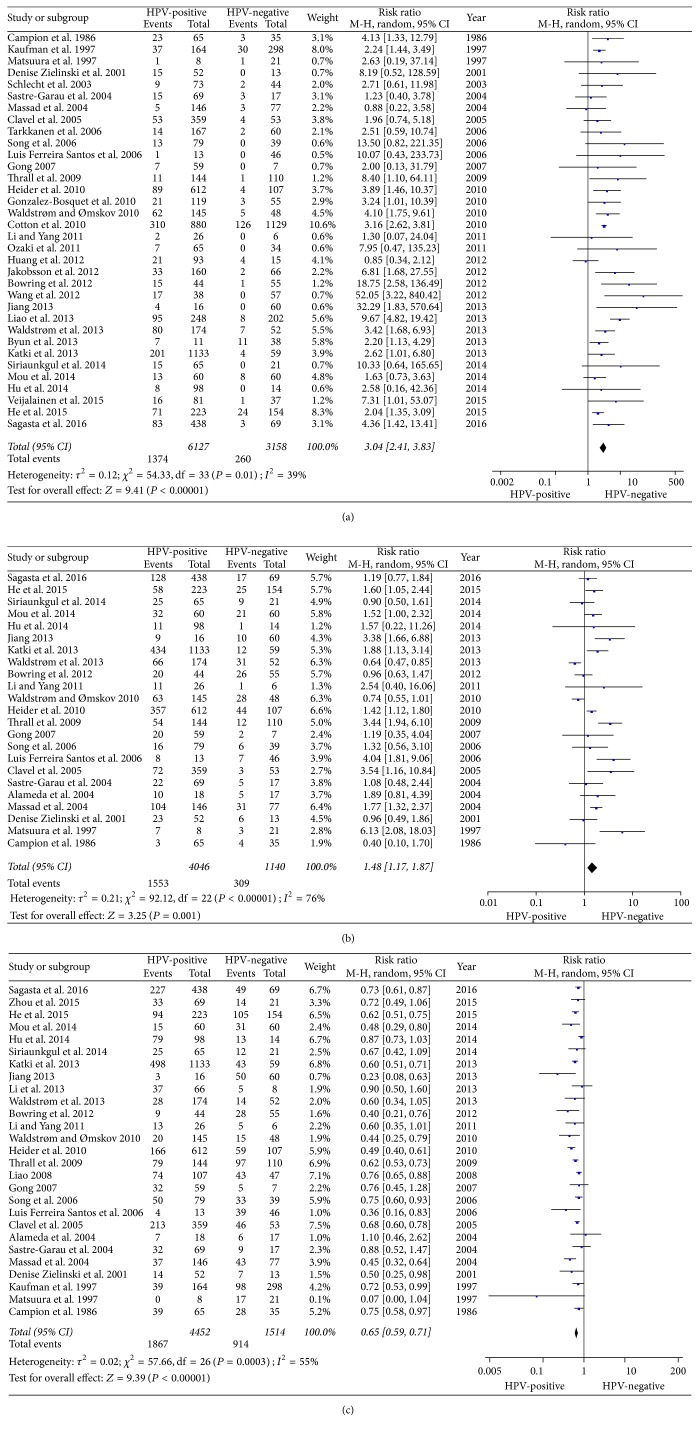
Figure 2.
Forest plot of HPV-positive patients and CIN1 disease outcomes. HPV positivity in the exposed group and HPV negativity in the control group. (a) Forest plot of HPV positivity and CIN1 disease progression; (b) Forest plot of HPV positivity and CIN1 disease persistence; (c) Forest plot of HPV positivity and CIN1 disease regression.

