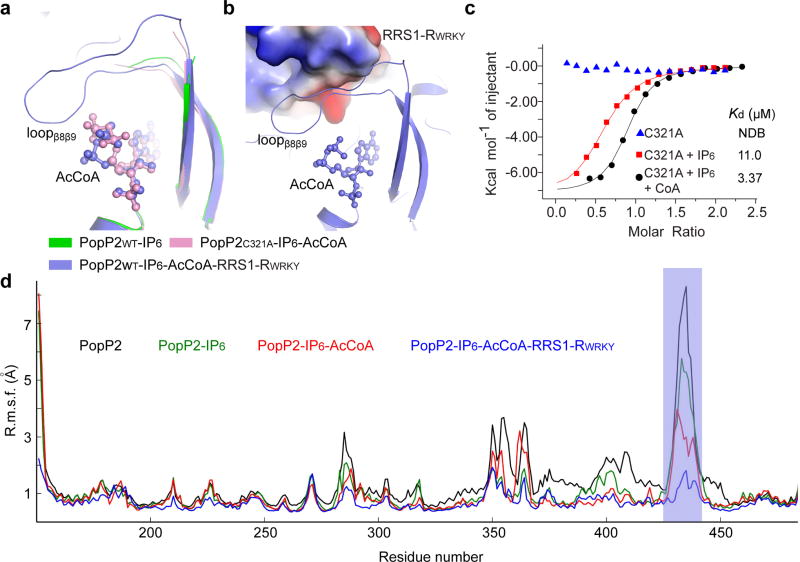
Figure 5. IP6-stimulated binding between PopP2 with RRS1-RWRKY.
a, Close-up view of the conformational change of the β8-β9 segment of PopP2 in different complexes. AcCoA is shown in ball-and-stick representation. b, The structure of loopβ8β9 in the PopP2WT– IP6 – AcCoA – RRS1-RWRKY complex. The PopP2-binding site of RRS1-RWRKY is shown in electrostatic surface representation. c, ITC binding curves of PopP2 with RRS1-RWRKY in the presence or absence of IP6 and/or CoA. d, RMSF of atomic fluctuations of PopP2, free or in complex with IP6, AcCoA and/or RRS1-RWRKY. The region corresponding to loopβ8β9 is shaded in blue.

