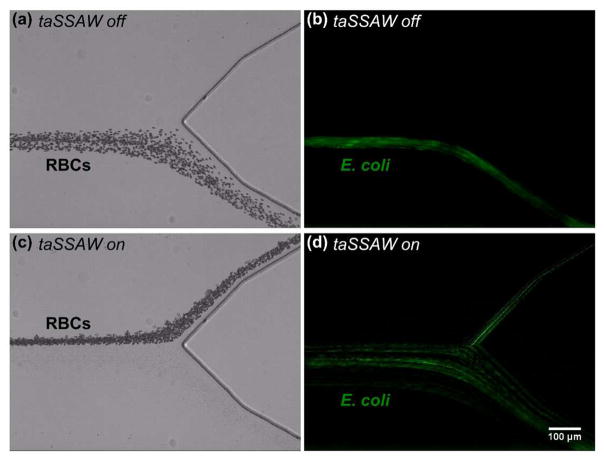
Figure 3.
Stacked micrographs showing the acoustofluidic separation of E. coli from RBCs. (a, c) Bright-field and (b, d) fluorescence images represent RBCs and E. coli, respectively. (a–b) When the taSSAW was not applied, RBCs and E. coli were collected together from the lower outlet in a mixture. (c–d) When the taSSAW was applied, RBCs were pushed to the upper outlet while E. coli were collected from the lower outlet.

