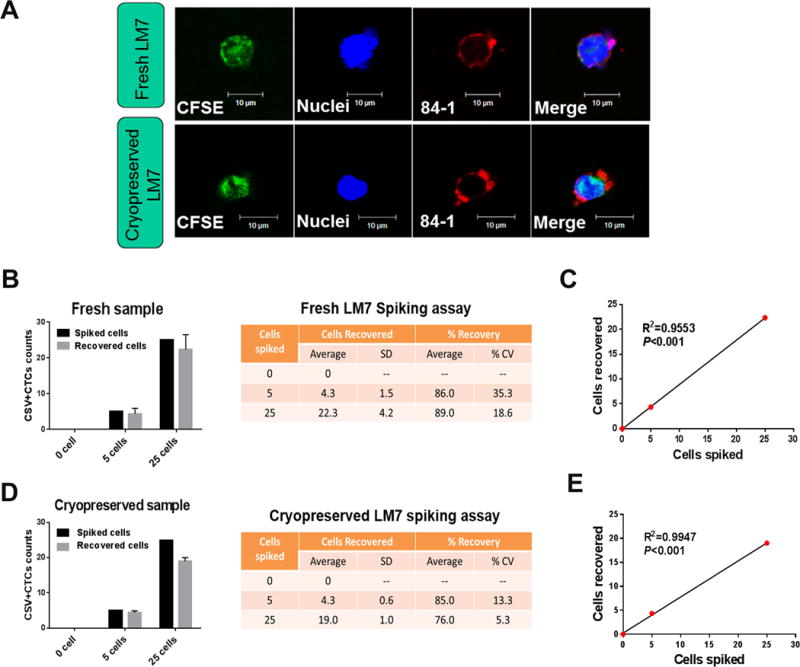
Figure 3. Spiking assay results.

(A) Micrographs showing CFSE-labeled LM7 cells in the fresh and cryopreserved peripheral blood mononuclear cells from healthy donors. Graphs and tables show the recovery rates for each concentration of spiked cells in the fresh samples (B) and cryopreserved samples (D). The mean results are from at least three independent experiments (error bars indicate standard deviation). Correlations of CTCs counts between the numbers of recovered cells and spiked cells in the fresh samples (C) and cryopreserved samples (E). CSV (84-1, red), tracker dye CFSE (green) and nuclear stain (blue). Scale indicates 10 μm. SD, standard deviation; CV, coefficient of variation.
