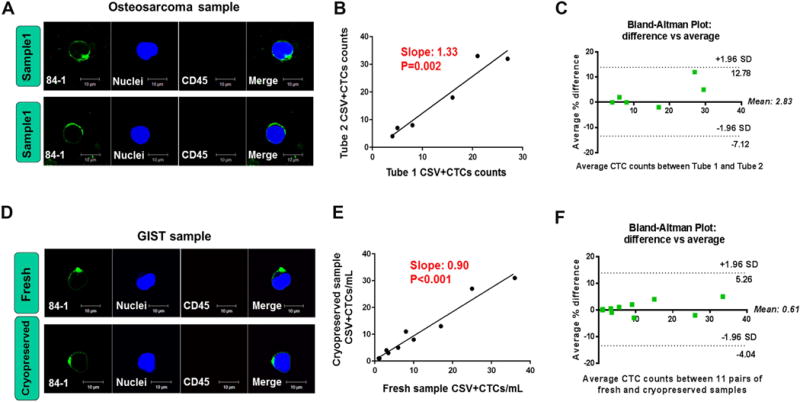
Figure 4. Comparison of CTCs counts between matched samples.

(A–C) Duplicate samples of osteosarcoma PBMCs (N=6) that had been cryopreserved for 2 to 3 years were measured. (D–F) Matched fresh and cryopreserved samples from multiple types of metastatic sarcoma were compared (N=11). (A, D) Immunofluorescent staining for cell surface vimentin and CD45. (B, E) Correlations between CTCs counts for matched samples. (C, F) Bland-Altman plots of the average differences between the matched samples. CSV (84-1, green), CD45 (red), nuclear stain (blue). GIST, Gastrointestinal stromal tumor. Scale indicates 10 μm.
