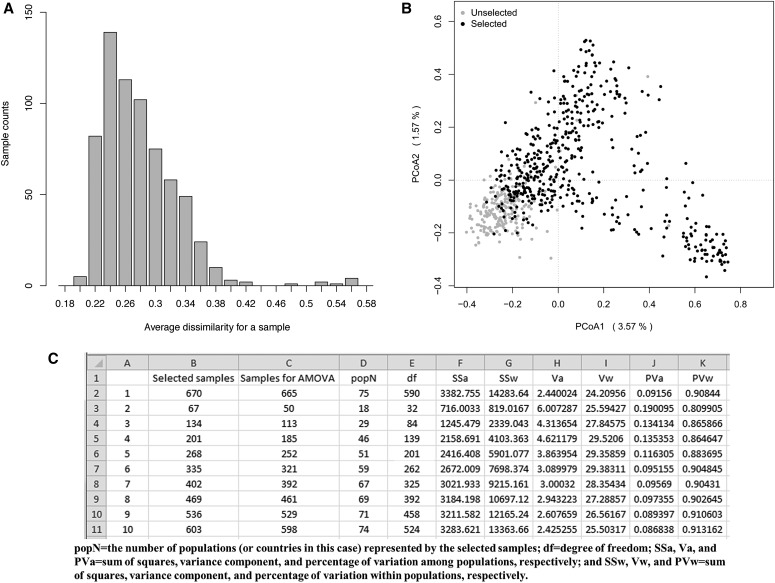
Fig. 1.
Illustration of AveDissR outputs for assessing genetic distinctness in an AFLP assay of 670 oat accessions. (A) Average dissimilarity (AD) frequency distribution in 670 oat accessions. (B) PCoA plot for the genetic associations of 461 accessions selected based on the highest AD values and original 670 accessions (selected accessions are shown in black). (C) Iterative AMOVA results from a stepwise selection of 10% in 670 oat samples; outputs show the changes in genetic differentiation (measured with PVa) with the increased selection of accessions with the highest AD values.

