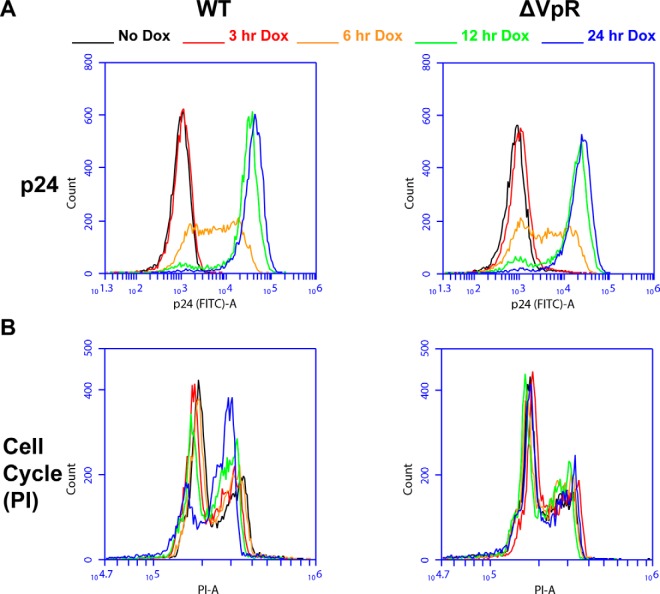
Fig. 1.
- Characterization of the Jurkat WT and ΔVPR cell lines following induction of HIV with doxycycline treatment. A, Time course of HIV-1 Gag/p24 expression in WT and ΔVPR cells. Conditions are color coded as above for 0, 3, 6, 12, and 24 h postdoxycycline induction of HIV expression. Histograms show FITC (intracellular Gag/p24) intensity for live gated WT (left) and ΔVPR (left) cells. B, The cell cycle block (or not) in these cells. WT (left) and ΔVPR (right) cells were labeled with PI and gated on live single cells. Histograms show PI-labeled DNA content with the lower peak representing cells in G0/G1 and the higher peak representing cells at G2/M phase.

