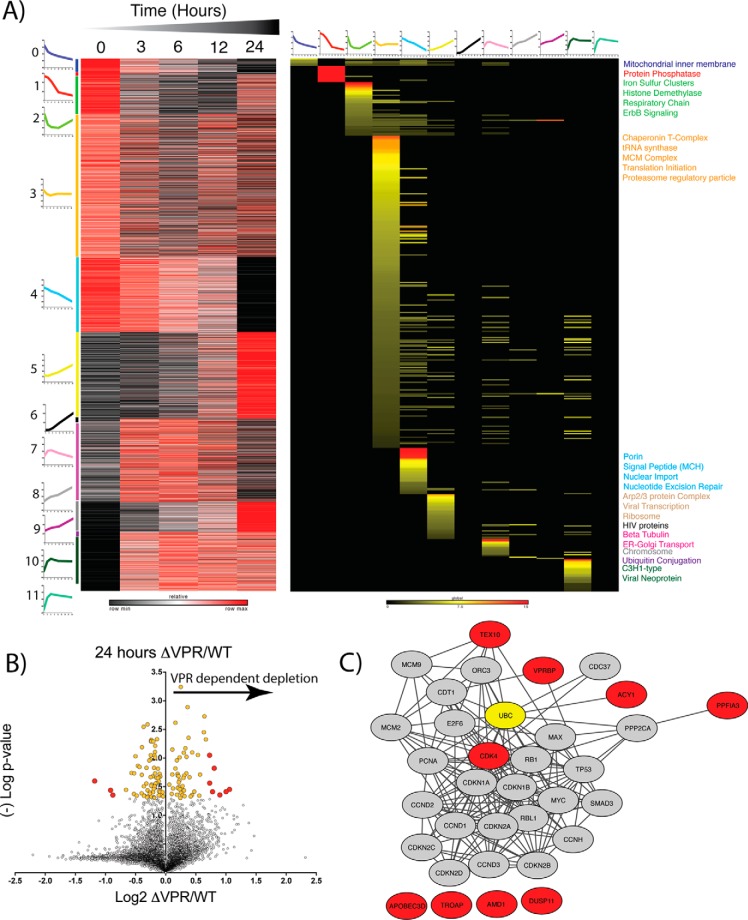
Fig. 4.
- Proteomic Profiling of ΔVPR cells reveals potential host targets of Vpr. A, K-means clustering of proteins allows Gene ontology enrichment analysis of profiles of enriched clusters of protein functions. Average cluster profiles are depicted beside and on top of the gene and GO based heat maps respectively. Heat map of proteins is relative z-score per row with black representing minimum and red maximum. Heat map of Gene ontology analysis reflects significant enrichment factors and is on a global scale. Black is not present, yellow low enrichment and red high enrichment. Terms on the right of the plot are colored dependent upon the colored bar on the left of the protein heat map corresponding to the adjacent k-means cluster. B, Volcano plot of vpr-deletion (ΔVPR) relative to wild-type (WT) protein level changes at 24 h post viral induction. X-axis shows log2 fold change and y axis (-)Log of Student's t test based p value. Yellow dots are significantly enriched proteins (p < 0.05) and red dots are significantly enriched and greater than two standard deviations from the median. C, STRING-db analysis of proteins significantly enriched (red dots) in ΔVPR relative to WT HIV. Red nodes correlate to red dots, and ubiquitin is highlighted in yellow.

