Fig. 6.
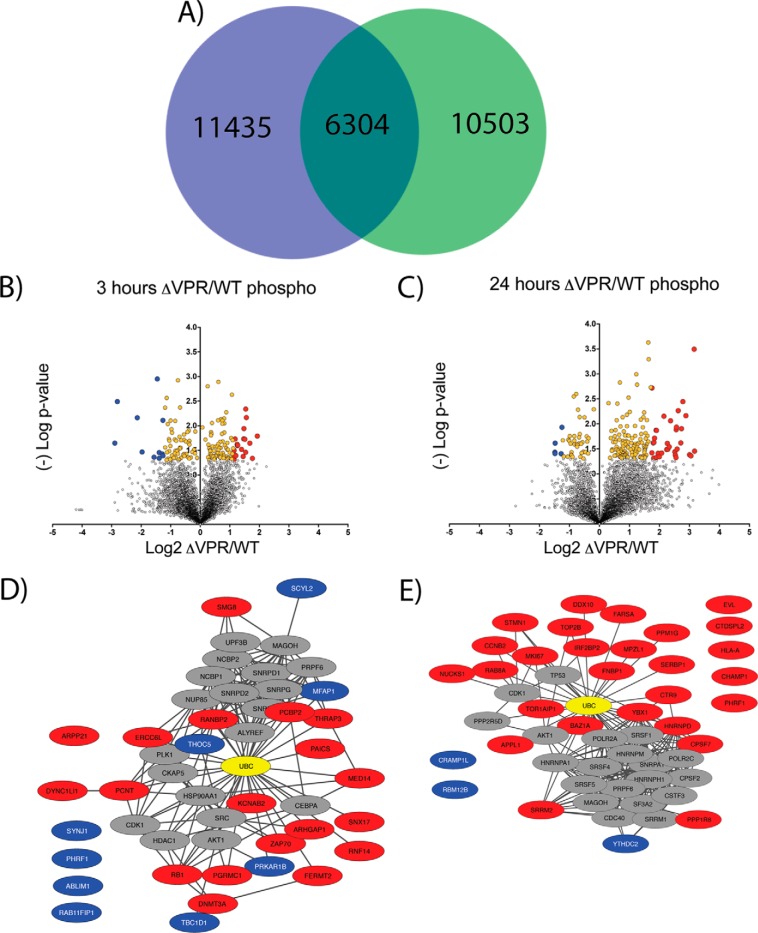
- Phospho-proteomic profiling of ΔVPR cells reveals potential host targets of Vpr. A, Venn Diagram showing overlap of phospho-peptides identified and quantified between wild-type (green) and ΔVPR cell lines (blue). The 6,304 phospho-peptides in common were used for subsequent analyses. B, Volcano plot of ΔVPR relative to wild-type (WT) phospho-peptide level changes at 3 h post viral induction. X-axis shows log2 fold change and y axis (-)Log of Student's t test based p value. Yellow dots are significantly enriched proteins (p < 0.05) and blue and red dots are significantly enriched and greater than two standard deviations from the median up-(blue) or down-regulated (red) relative to ΔVPR. C, Volcano plot of ΔVPR relative to WT phospho-peptide level changes at 24 h post viral induction. D, STRING-db analysis of phospho-proteins significantly enriched (red and blue dots) in ΔVPR relative to WT HIV at 3 h post induction. E, STRING-db analysis of phospho-proteins significantly enriched (red and blue dots) in ΔVPR relative to WT HIV at 24 h post induction. Ubiquitin is highlighted in yellow in STRING plots.

