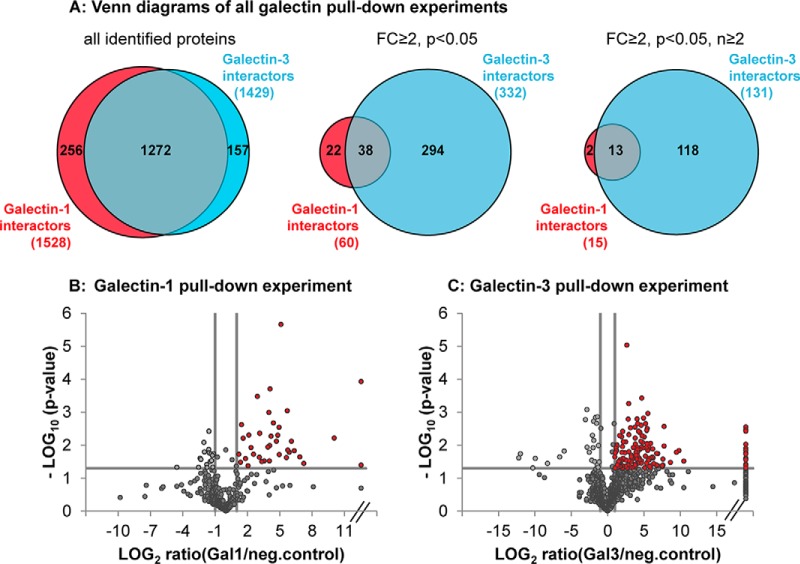
Fig. 1.
Galectin-3 revealed more significant interacting binding partners than galectin-1. A, numbers of protein identifications in all Gal-1 (red) and Gal-3 (blue) pulldown experiments (left Venn diagram); numbers of protein identifications of all significantly enriched (p < 0.05) proteins with an enrichment factor over or equal to 2 in the galectin β-lactose eluates compared with negative control (FC ≥2) (central Venn diagram) and of all significantly enriched proteins (p < 0.05, FC ≥2) that could be detected in two or more independent pulldown experiments (right Venn diagram). Numbers of overlapping protein identifications are also represented (gray). B and C, volcano plot representation of one exemplary galectin-1 (B) and one exemplary galectin-3 (C) pulldown experiment (with three replicates each). The log2 transformed ratios between normalized abundances of all proteins identified in lactose eluates of galectin pulldown compared with unspecific control (Protein-G pulldown) is plotted against the respective negative log10 transformed p values of the t test. p values of p < 0.05 and additional regulation of ≥2-fold were regarded as significant (red dots). Infinite fold changes were set to the highest measured ratio plus 1 (dots on the right side of the plot); fold changes with a value of 0 were equalized with the lowest measured ratio (dots on the left site of the plot).

