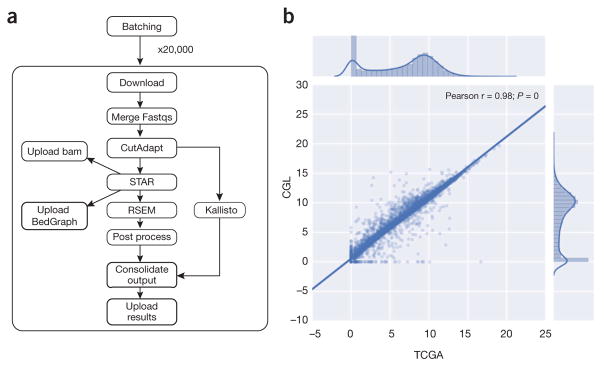
Figure 1.
RNA-seq pipeline and expression concordance. (a) A dependency graph of the RNA-seq pipeline we developed (named CGL). CutAdapt was used to remove extraneous adapters, STAR was used for alignment and read coverage, and RSEM and Kallisto were used to produce quantification data. (b) Scatter plot showing the Pearson correlation between the results of the TCGA best-practices pipeline and the CGL pipeline. 10,000 randomly selected sample and/or gene pairs were subset from the entire TCGA cohort and the normalized counts were plot against each other; this process was repeated five times with no change in Pearson correlation. The unit for counts is: log2(norm_counts+1).

