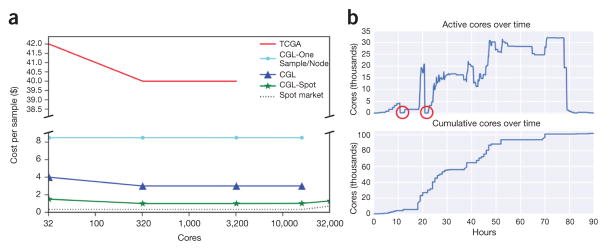
Figure 2.
Costs and core usage. (a) Scaling tests were run to ascertain the price per sample at varying cluster sizes for the different analysis methods. TCGA (red) shows the cost of running the TCGA best-practices pipeline as re-implemented as a Toil workflow (for comparison). CGL-One-Sample/Node (cyan) shows the cost of running the revised Toil pipeline, one sample per node. CGL (blue) denotes the pipeline running samples across many nodes. CGL-Spot (green) is the same as CGL, but denotes the pipeline run on the Amazon spot market. The slight rise in cost per sample at 32,000 cores was due to a couple of factors: aggressive instance provisioning directly affected the spot price (dotted line), and saving bam and bedGraph files for each sample. (b) Tracking number of cores during the recompute. The two red circles indicate where all worker nodes were terminated and subsequently restarted shortly thereafter.

