
Figure 3. Conceptual model of a complex population history.
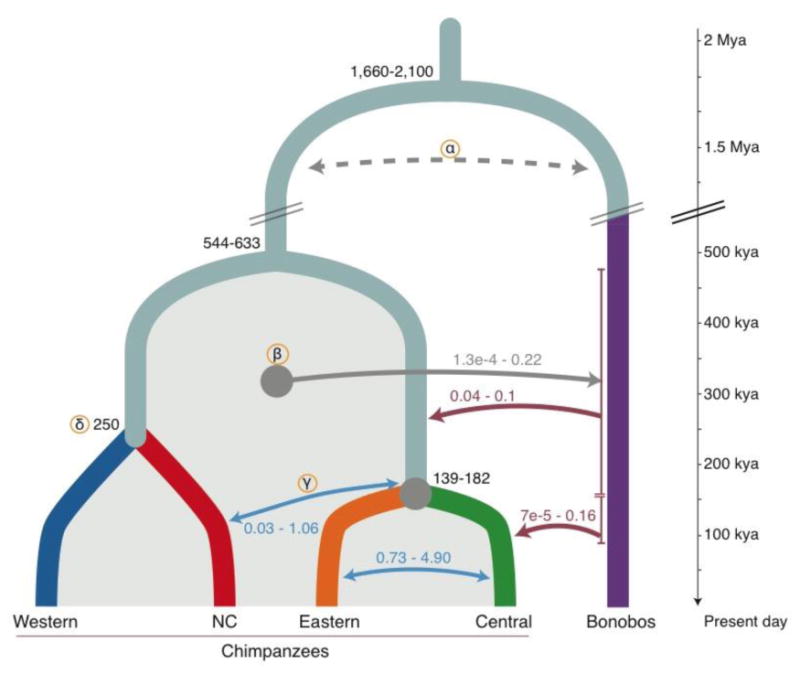
SFS-based modeling infers several contacts between chimpanzees and bonobos after their divergence. Split times (Kya) and migration rates correspond to 95% confidence intervals (CI) obtained with the demographic model with western, central and eastern chimpanzees (10). Quantification of gene flow as migration rates scaled by the effective size (2Nm). Red arrows: gene flow from bonobos into chimpanzees. The ancestral population of central and eastern chimpanzees received the highest amount of bonobo alleles, while central chimpanzees received additional, more recent gene flow (<200 Kya). Blue arrows: Highest inferred migrations within chimpanzee subspecies; intense gene flow between central and eastern chimpanzees. (α) Dotted line: Putative ancient gene flow between the ancestors of all chimpanzees and bonobos is inferred by the model. (β) More recent gene flow from chimpanzees into bonobos is inferred. Shaded area: Range of estimates across all chimpanzee populations. (γ) Inferred admixture between Nigeria-Cameroon and central/eastern chimpanzees; indirect gene flow from bonobos into Nigeria-Cameroon chimpanzees might have occurred through these contacts. (δ) Divergence time between western and Nigeria-Cameroon chimpanzees is estimated by using MSMC2 (10).