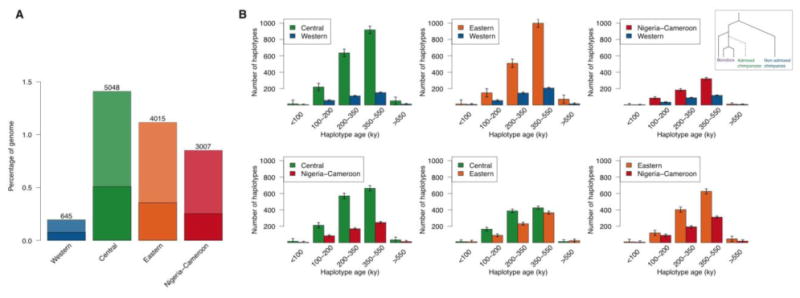
Figure 4. Introgressed segments and inferred age of introgressed haplotypes.

(A) Numbers of putatively introgressed segments in heterozygosity per population, and proportion of the chimpanzee genome. Dark bars represent segments uniquely found in each population, grey bars simulations without gene flow. (B) Age distribution of bonobo-like haplotypes in chimpanzee populations as estimated by ARGweaver. Chimpanzee subspecies are compared pairwise, and bonobo-like haplotypes are defined as regions of at least 50 Kbp that coalesce within the bonobo subtree before coalescing with the other chimpanzee population (inset). Error bars represent 95% confidence across MCMC replicates (10).
