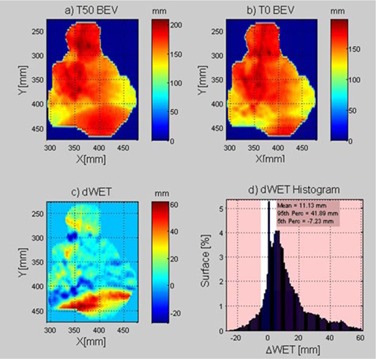
Figure 1.

Example output from the ΔWET analysis software for an example treatment field at 250°. On the top row is the beam's‐eye view WET depth matrix to the distal edge of the target for T50 (a) and T0 (b). The ΔWET matrix (c) is calculated from the difference of the first two images. To visually assess the ΔWET per field, a histogram (d) is shown of ΔWET.
