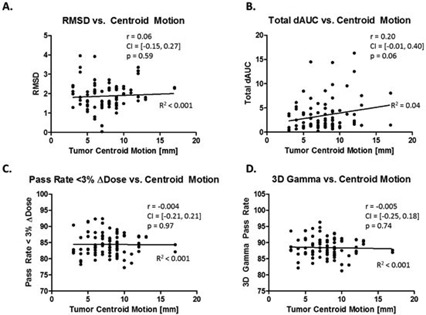
Figure 3.

Plots of ΔDose for the 87 normalized field doses were plotted against the tumor centroid motion observed for each patient. Pearson correlation coefficients (r), 5%‐95% confidence intervals, and p‐values of the correlation coefficient were calculated between ΔDose metrics and the tumor motion.
