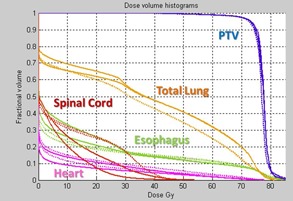
Figure 7.

For the example patient in Fig. 6, the original plan T50 and T0 DVH curves (solid lines) are shown in comparison to the ΔWET reduced plan T50 and T0 (dotted lines).

For the example patient in Fig. 6, the original plan T50 and T0 DVH curves (solid lines) are shown in comparison to the ΔWET reduced plan T50 and T0 (dotted lines).