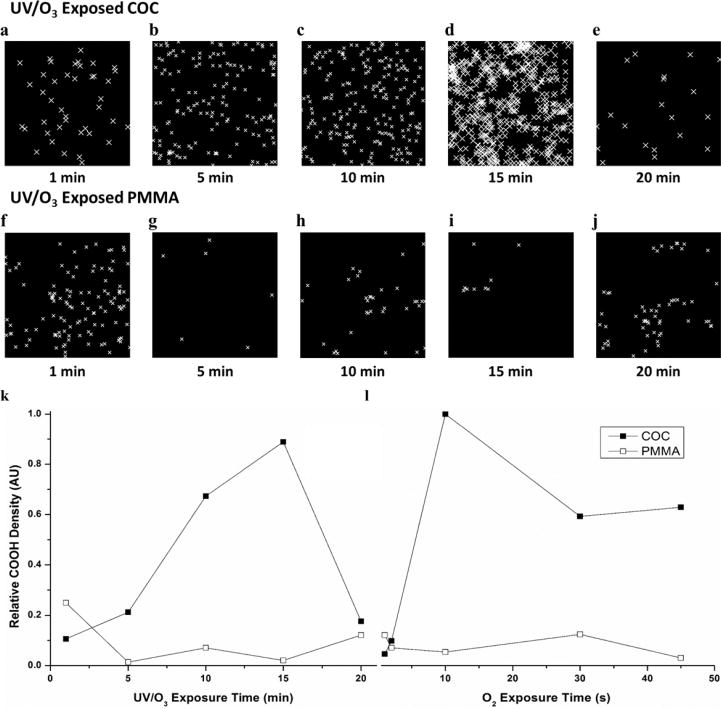
Figure 2.

Representative STORM images of 1 μm2 (a–e) COC and (f–j) PMMA exposed to 1, 5, 10, 15, and 20 min UV/O3 radiation, respectively. Relative –COOH density vs exposure time for (k) UV/O3 and (l) O2 plasma-modified COC (closed squares) and PMMA (open circles). Lines are for visual purposes only. UV/O3 and O2 plasma exposure conditions were kept constant (see text for details). All total localizations were normalized to the greatest localization density, COC exposed to 10 s of O2 plasma.
