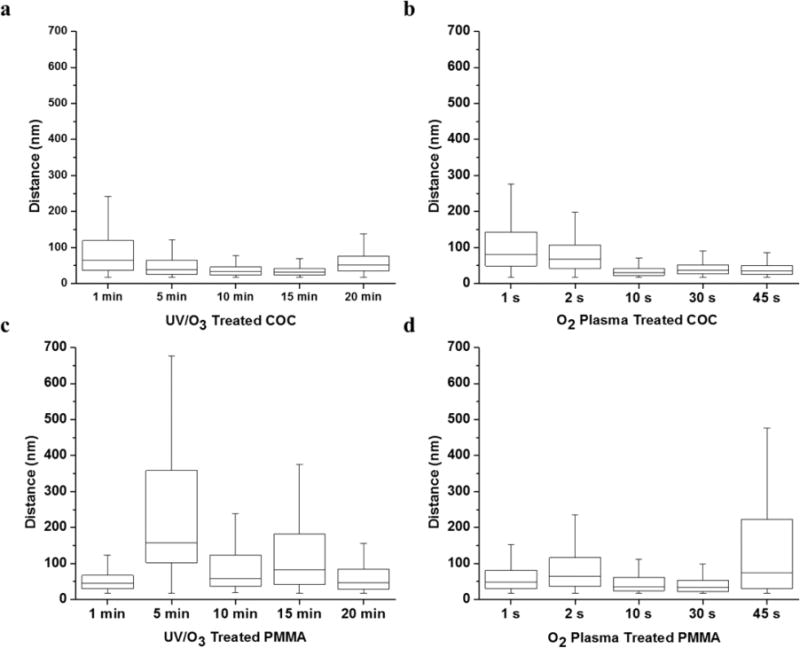
Figure 3.

Distance between fluorophores in 1 μm2 subset images (see Figure 2) for (a) UV/O3 modified COC; (b) O2 plasma-modified COC; (c) UV/O3 modified PMMA; and (d) O2 plasma-modified PMMA. Error bars represent range; upper and lower edges of the boxes indicate the third and first quartiles, respectively, and the midline shows the median.
