
Figure 2.
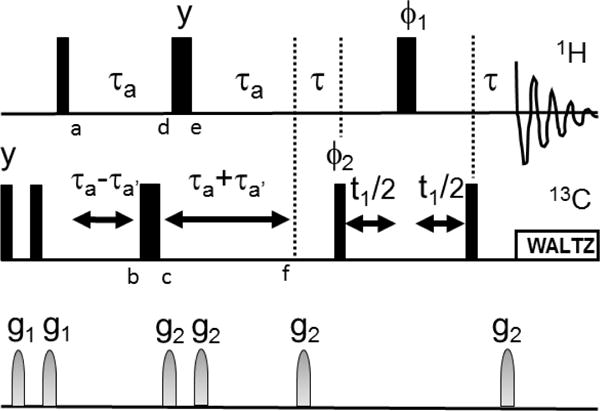
Pulse sequence for measurement of RDCs from Methyl-TROSY spectra. is 1/(2JCH) and a is selected to allow peak intensity to modulate through two zero crossings (~20 ms). a′ moves the position of the 13C 180 pulse to allow J modulation by 13C-1H couplings. Letters a-f inserted below pulses denote points in spin evolution discussed in the text. All rf pulses are in the x direction except as indicated. 1 and 2 are as in (Tugarinov et al. 2003). Gradients were of 500 ms duration and intensity settings 8000 and 4000 for g1 and g2 respectively, 100 increments were collected in the indirect dimension with a spectral width of 20 ppm.