
Figure 1. PFC patient lesion overlap, working memory task design, and accuracy.
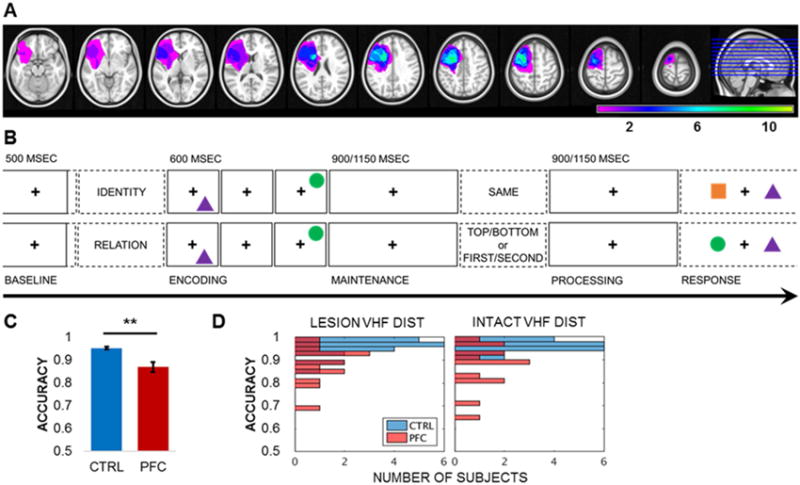
(A) Reconstruction of the extent of PFC lesion overlap for all 14 patients normalized to the left hemisphere. Color scale = number of patients with lesions at the specified site. See also Figures S1–S3 and Tables S1–S2.
(B) Single-trial lateralized working memory task design. Following a 2-sec pretrial fixation interval, subjects were cued to focus on either IDENTITY or RELATION information. Then, two common shapes were presented for 200 msec each to the left or right visual hemifield in a specific spatiotemporal configuration (i.e., top/bottom spatial and first/second temporal positions). After a 900- or 1150-msec jittered maintenance fixation interval, the test prompt appeared, followed by an active processing fixation interval of the same length. Working memory was tested in a two-alternative forced choice test, resulting in a 0.5 chance rate. In the identity test (top), subjects indicated whether the pair was the SAME pair they just studied (correct response: no). In the spatiotemporal relation test (bottom), subjects indicated which shape fit the TOP/BOTTOM spatial or FIRST/SECOND temporal relation prompt (correct response for prompt TOP or SECOND: circle). See also Figures S2–S3.
(C) Mean working memory task accuracy by group. Patient accuracy was attenuated relative to controls (p < 7×10⁻⁵). ** = significant result; error bars = SEM; CTRL, controls; PFC, PFC patients; VHF, visual hemifield. See also Table S3.
(D) Single-subject histograms of working memory task accuracy by visual hemifield presentation. Accuracy did not differ by visual hemifield presentation (uncorrected p > 0.05). DIST, distribution; CTRL, controls; PFC, PFC patients. See also Table S3.