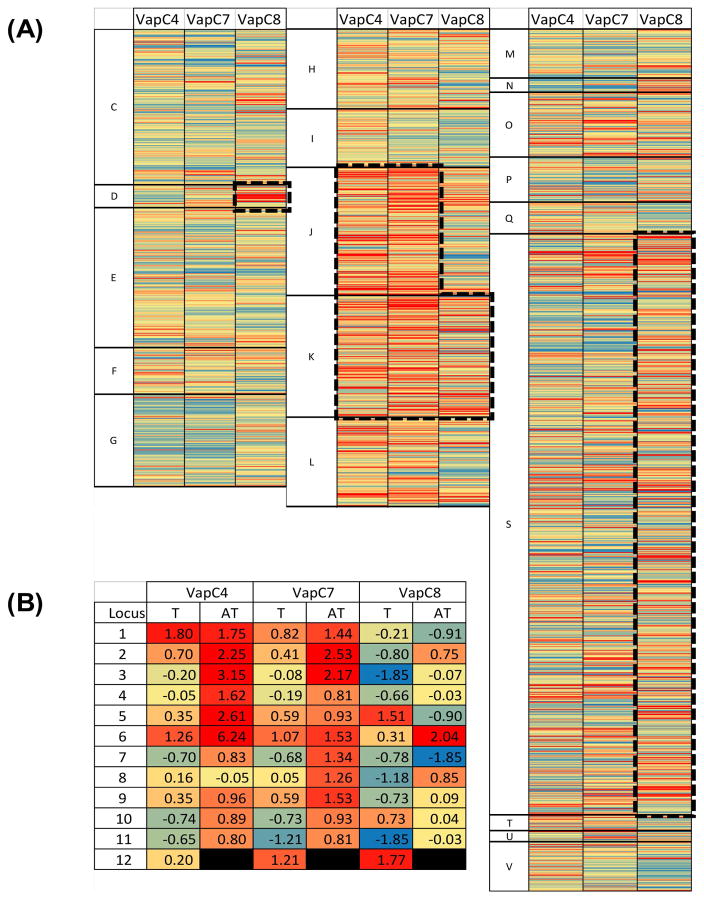
Figure 4. Heat plot visualization of VapC4, C7, and C8 targeting of the whole transcriptome.
(A) For each VapC (4, 7, and 8), the number of cut sites per bp and resulting z-score were calculated for each gene in the transcriptome. The color scale is a gradient from blue (low z-score) to red (high z-score). (A) whole transcriptome: Genes are arranged based on their COG grouping and ordered based on locus ID. (B) VapBC loci.

