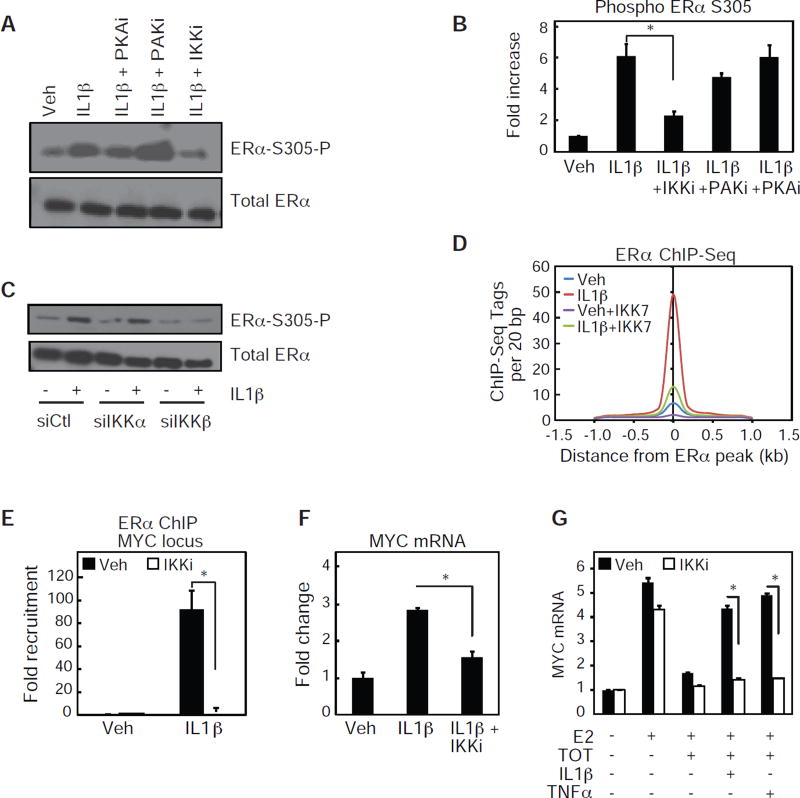
Figure 4. IKKβ phosphorylation of S305 ERα is required for cytokine-dependent ERα activation.
(A) Western blot analysis for ERα-S305-P and ERα in MCF-7 cells treated with Veh, or IL1β in the absence or presence of inhibitors for PKA, PAK1and IKKα/β.
(B) Quantification of two independent western blot analysis as performed in figure 4A. Values are expressed as mean ± SEM.*p<0.05, (Student’s t-test) compared to IL1β sample.
(C) Western blot analysis for ERα-S305-P and total ERα in MCF-7 cells treated with siRNA for Ctl, IKKα, or IKKβ and treated with Veh or IL1β.
(D) Histogram of ERα ChIP-Seq signal in the presence of Veh, IL1β, IKK7, or a combination ofIL1β andIKK7.
(E) ChIP-PCR of ERα recruitment to the MYC genomic locus in the presence of Veh, IL1β, or a combination of IL1β and IKK7. Values are expressed as mean ± SEM. *p<0.05, (Student’s t-test) IL1β + IKK7 compared to IL1β sample.
(F) Quantitative real-time PCR data for MYC mRNA in MCF-7 cells treated with Veh, IL1β, or a combination of IL1β and IKK7. Values are expressed as mean ± SEM.*p<0.05, (Student’s t-test) IL1β +IKK7 compared to IL1β sample.
(G) Same as F, but cells were also treated with TOT or TNFα, as indicated.

