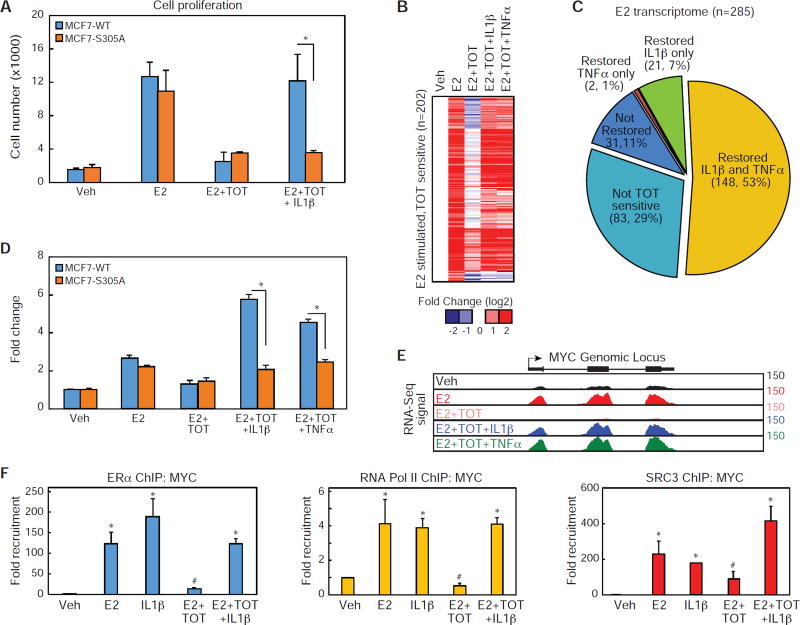
Figure 5. Phosphorylation of ERα at S305 is required for cytokine-dependent ERα activation.
(A) Cell proliferation assay for MCF7 cells expressing either WT or S305A estrogen receptors. Cells were treated with Veh, E2, E2 + TOT, E2 + TOT + IL1β for 6 days. Values are expressed as mean ± SEM. *p<0.05, (Student’s t-test) compared to MCF7 WT ERα cells.
(B) Heat map for mRNA-Seq expression of the 202 transcripts regulated in MCF7 cells treated with E2 that are sensitive to TOT. The mRNA expression is shown for MCF7 cells treated with Veh, E2, E2 + TOT, E2 + TOT + IL1β, and E2 + TOT + TNFα.
(C) Pie graphs showing the percentage of E2 regulated genes sensitive to TOT treatment. The genes sensitive to TOT treatments are further stratified based on whether addition of IL1β or TNFα, restores expression mRNA levels to near E2 induced levels.
(D) QPCR data for MYC mRNA in MCF-7 cells expressing either ERα or ERα-S305A treated with Veh, E2, E2 + TOT, and E2+ TOT+ IL1β. Values are expressed as mean ± SEM. *p<0.05, (Student’s t-test) ERα compared to ERα S305 sample.
(E) UCSC genome browser image for mRNA-Seq expression at the MYC genomic locus.
(F) ChIP-PCR of ERα, Pol II, or SRC3 recruitment to the MYC genomic locus in the presence of Veh, E2, I L1 β, and TOT, or E2 + TOT + IL1β. Values are expressed as mean ± SEM. *p<0.05, (Student’s t-test) compared to Veh treatment. #p<0.05, (Student’s t-test) compared to E2 treatment.

