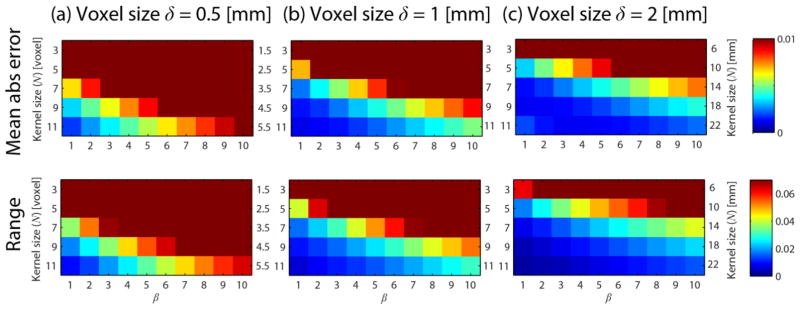
Fig. 3.
Mean absolute error (first row) and range (second row) of estimates for different voxel sizes δ = {0.5, 1,2} mm (a–c, columns). Each color plot shows the results for different choices for the kernel size N (indicated in voxel on the left side of each graph and in mm on the right side of each graph) and different settings for β. We used κ = 1/ρ = 1/26 mm−1, k = 250, and p = (10, −10,0).

