
Figure 2.
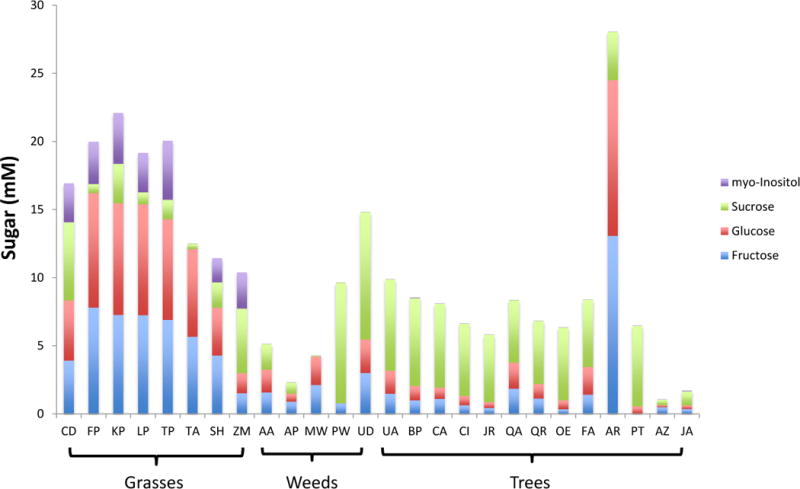
Sugar content in the various pollens. A stacked bar graph presents the amount of myo-inositol (purple), sucrose (green), glucose (red), and fructose (blue) measured in the pollen extracts. The abbreviations for the species names are shown in Supplementary Table 1.