
Figure 3.
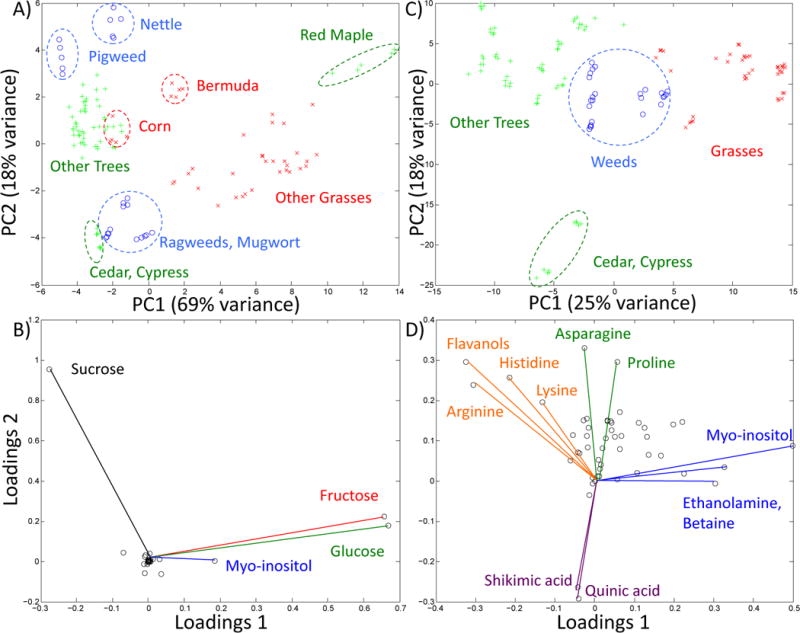
Principal component analysis of pollen extracts. A) Principal components 1 and 2 utilizing the quantity of all 52 metabolites from 26 pollens, 5 preparations per species: grasses (red x), weeds (blue o), and trees (green +). Dashed circles and names annotate the various clusters. B) Loading plot for principal components 1 and 2 of panel A. Important compounds are labeled. C) Principal components 1 and 2 using a log2 transform of metabolite concentrations (see text). D) Loading plot for principal components 1 and 2 of panel C. Important compounds are labeled.