
Figure 5.
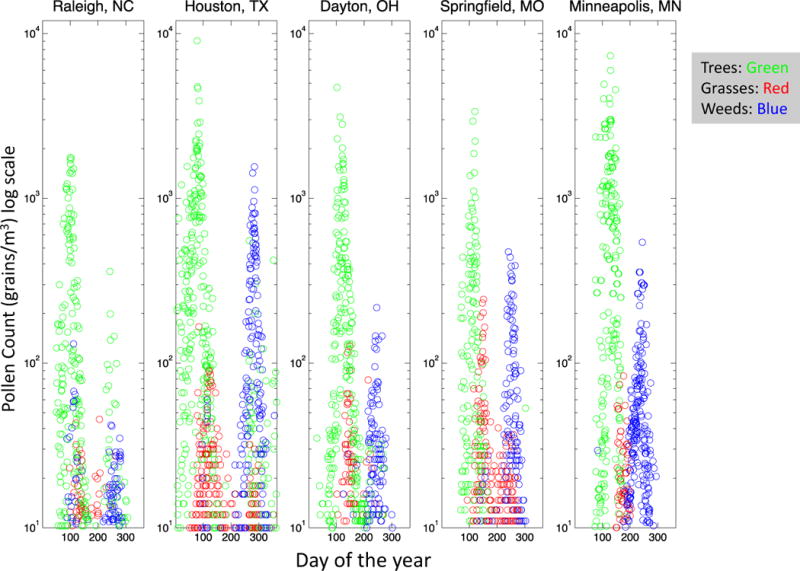
Pollen counts for various North American Cities over a recent 3 year period. Pollen count data in grains/m3 is overlayed for 3 consecutive recent years. See text for details. Count data is colored red for grasses, blue for weeds, and green for trees.