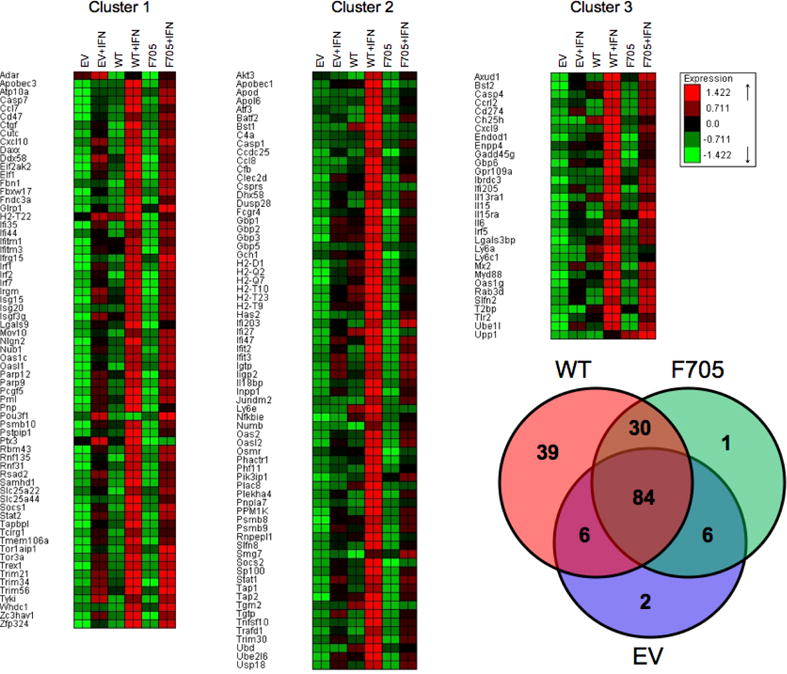
Figure 2. Microarray analysis of ISG expression.

The Venn diagram shows the distribution of the 168 ISGs (Fold induction by IFN >2, P<0.05) between KO+EV, KO+WT and KO+F705−STAT3 MEF lines. Based on expression patterns, the ISGs were partitioned into three clusters: cluster 1 represents STAT3-independent ISGs; cluster 2 represents tyrosine phosphorylated STAT3-regulated ISGs; and cluster 3 represents unphosphorylated STAT3-regulated ISGs.
