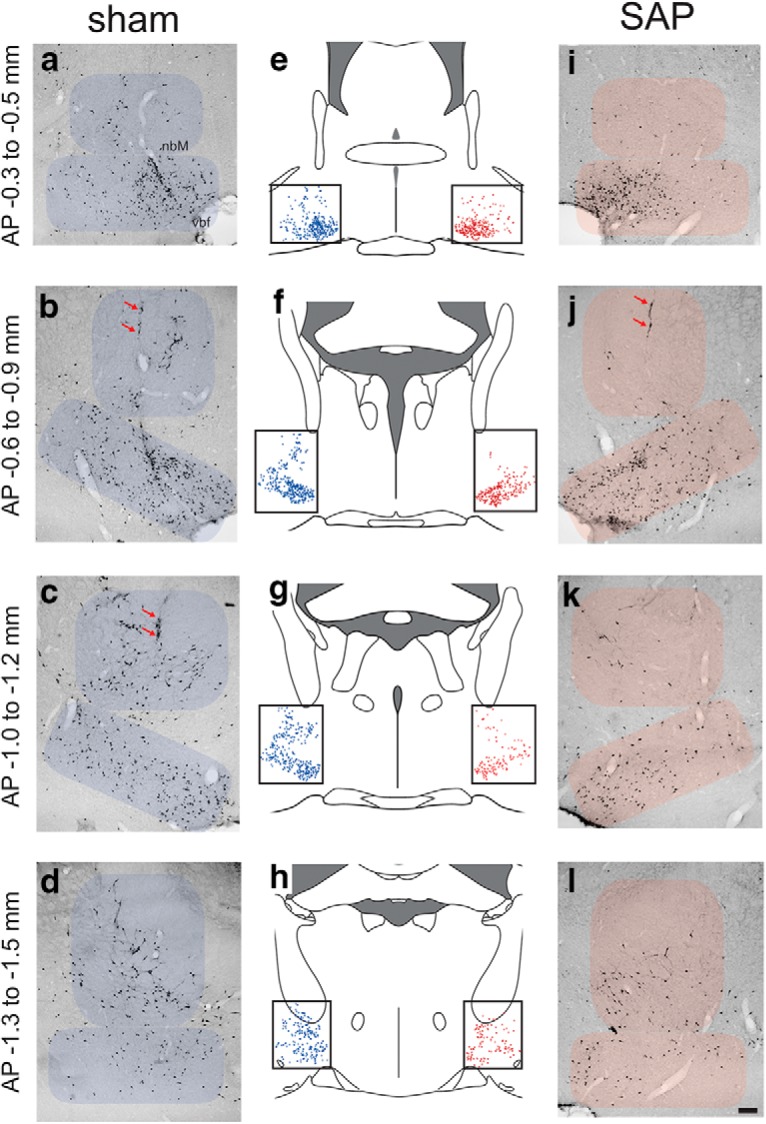
Figure 7.

ChAT-IR neurons on coronal sections from sham-operated (a–d) and SAP-lesioned (i–l) rats at AP levels −0.4, −0.9, −1.1, and −1.4 relative to bregma. Red arrows in b, j, and c indicate tracts produced by insertion of the infusion needle. The number of ChAT-IR neurons was estimated in two subregions of the basal forebrain: nbM and vbf (consisting of SI, MCPO, and HDB). Schematic drawings from each corresponding AP (middle column; e–h) illustrate the representative distribution of ChAT-IR neurons (blue dots) for sham-operated and the pattern of remaining neurons after SAP lesions (red dots; scale for all photomicrographs, in the bottom right corner in l:200 μm).
