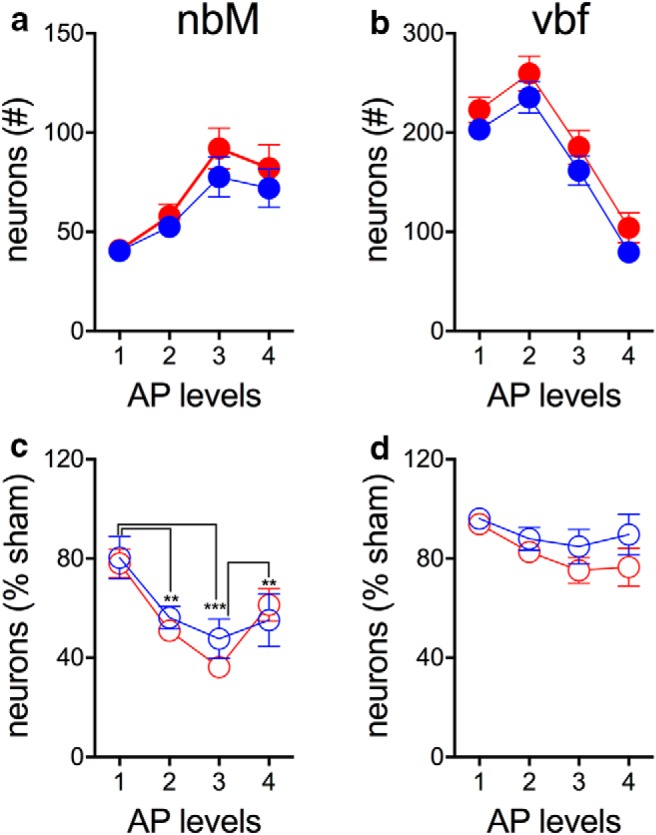
Figure 8.

Semiquantitative estimates of ChAT-IR neurons in the two subregions of the basal forebrain (nbM, vbf; see also Fig. 7) of sham-operated STs (filled red circles; a) and GTs (filled blue circles; b) and after infusions of the cholinotoxin SAP (empty red and blue circles in c, nbM, and d, vbf; ST sham: n = 10; GT sham: n = 9; ST SAP: n = 9; GT SAP: n = 8; AP levels: 1: −0.2 to −0.5 mm relative to bregma; 2: −0.6 to −0.9 mm; 3: −1.0 to −1.2 mm; 4: −1.3 to −1.5 mm]. Post hoc comparisons of main effects of AP level reflected in a that estimates at levels 1, 2, and 3 all differed from each other and in b that estimates at all levels differed from each other. For c, the results of post hoc comparisons of effects of AP levels are indicated (**p < 0.01, ***p < 0.001). A significant interaction between the effects of phenotype and AP levels on residual nbM neuron number estimates (c) reflected a lower number of residual cells at AP level 3 (p = 0.036) in STs compared with GTs.
