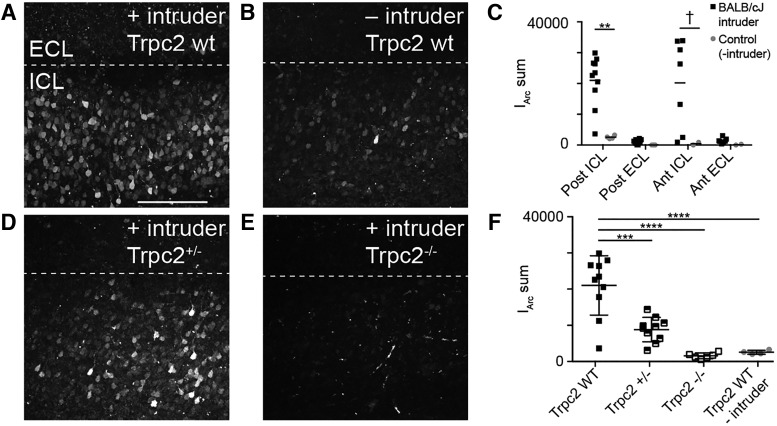
Figure 3.
Arc expression is not upregulated after the resident–intruder assay in Trpc2−/− mice. A, Maximum z-projection of an acute AOB slice taken from an Arc-d4EGFP-BAC, Trpc2+/+ resident. Posterior AOB is shown. Images were taken 4 h after exposure to a BALB/cJ intruder. Scale bar, 200 μm. B, Representative z-projection taken from a control resident that was not exposed to an intruder. C, Quantification of summed fluorescence intensity across d4EGFP-expressing cells (IArc sum). Significance in each region was determined using the Wilcoxon–Mann–Whitney test: **p < 0.01; †p < 0.1. Posterior ICL: n = 9 mice, 10 slices (experimental), n = 4 mice, 4 slices (control); posterior ECL: n = 9 mice, 10 slices (experimental), n = 3 mice, 3 slices (control); anterior ICL/ECL: n = 6 mice, 7 slices (experimental) n = 2 mice, 2 slices (control). D, Representative z-projection taken from a Trpc2+/− Arc-d4EGFP-BAC male resident. E, Representative z-projection taken from a Trpc2−/− Arc-d4EGFP-BAC male resident. F, Quantification of IArc sum for the posterior ICL of all genotypes. Trpc2+/−, n = 5 mice, 10 slices; Trpc2−/− n = 3 mice, 6 slices. One-way ANOVA, F(3,26) = 22.75, p < 0.0001. ***p < 0.001, ****p < 0.0001 for indicated pairs (corrected for multiple comparisons using Tukey's method).

