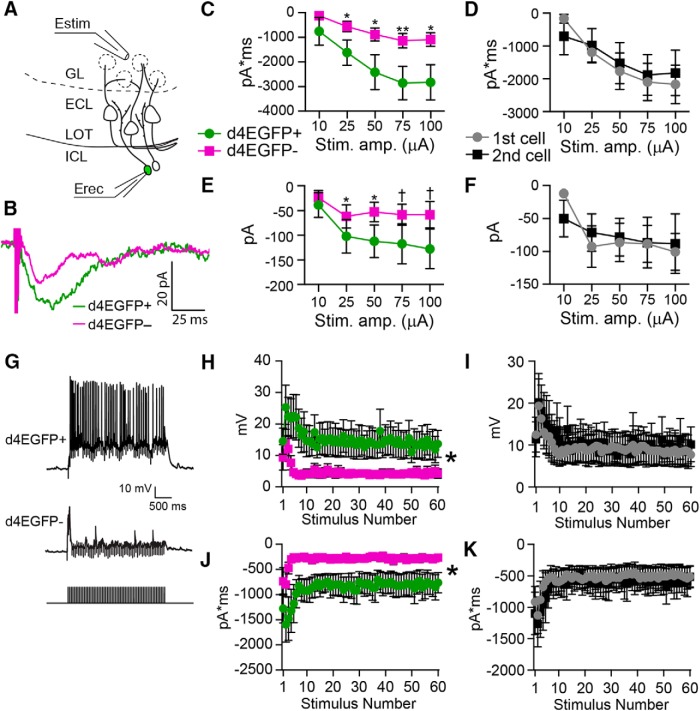
Figure 4.
Arc-expressing IGCs show increased excitation by glomerular layer stimulation. A, Diagram illustrating experimental setup. Estim, Theta glass stimulating electrode; Erec, recording electrode. B, Sample responses from a single, equal amplitude electrical stimulus from a d4EGFP+ cell and a nearby d4EGFP− cell from the same slice. C, Input–output curves showing charge transfer in response to a single stimulus pulse for d4EGFP+ and d4EGFP− cells. Paired, two-tailed Student's t test: *p < 0.05, **p < 0.01. D, Same data as from C, grouped by the order in which the cells were recorded rather than d4EGFP expression. E, Input–output curves showing EPSC amplitude in response to a single pulse; data grouped by d4EGFP expression. Paired, two-tailed Student's t test: †p < 0.1; *p < 0.05. F, Same data from E, grouped by the order in which cells were recorded. G, Sample traces from d4EGFP+ and d4EGFP− IGCs responding to 3 s, 20 Hz stimulation. H, Peak amplitude reached in response to each pulse of a 3 s, 20 Hz stimulus train. Repeated-measures ANOVA, main effect of group: F(1,18) = 4.51, p = 0.048. I, Same data from H, grouped by the recording order. Repeated-measures ANOVA, no main effect of group: F(1,18) = 0.03, p = 0.87. J, Total charge transfer in response to each pulse of the 3 s, 20 Hz stimulus train. Repeated-measures ANOVA, main effect of group: F(1,18) = 5.52, p = 0.03. K, Same data from J, grouped by recording order. Repeated-measures ANOVA, no main effect of group: F(1,18) = 0.07, p = 0.79. For all panels, n = 7 mice, 10 slices, 10 pairs. Stim. amp., Stimulus amplitude.

