Figure 5.
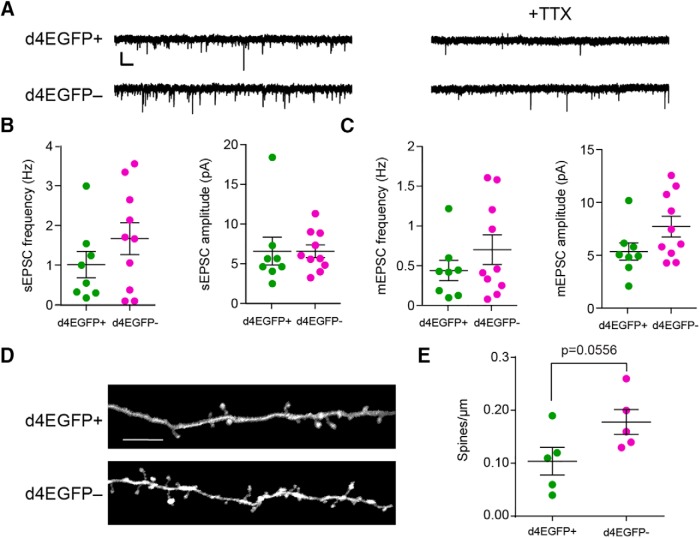
Arc-expressing IGCs do not display enhanced synaptic strength or number compared with nonexpressing IGCs. A, Sample sEPSC and mEPSC traces from d4EGFP+ and d4EGFP− neurons. Calibration: 10 pA, 500 ms. B, Spontaneous frequency and amplitude in d4EGFP+ IGCs. Significance determined using Wilcoxon–Mann–Whitney test (n.s., p > 0.05). d4EGFP+, n = 8; d4EGFP−, n = 10; n mice = 10. C, Mini-frequency and amplitude of d4EGFP+ and d4EGFP− IGCs. Significance determined using Wilcoxon–Mann–Whitney test (n.s., p > 0.05). d4EGFP+, n = 8; d4EGFP− n = 10; n = 10 mice. D, Representative images showing dendritic spines on d4EGFP+ and d4EGFP− IGCs. Scale bar, 10 μm. E, Spines per micrometer for d4EGFP+ and d4EGFP− neurons. Significance determined using Wilcoxon–Mann–Whitney test. d4EGFP+ cells, n = 5; d4EGFP− cells, n = 5; n = 5 mice.

