Figure 6.
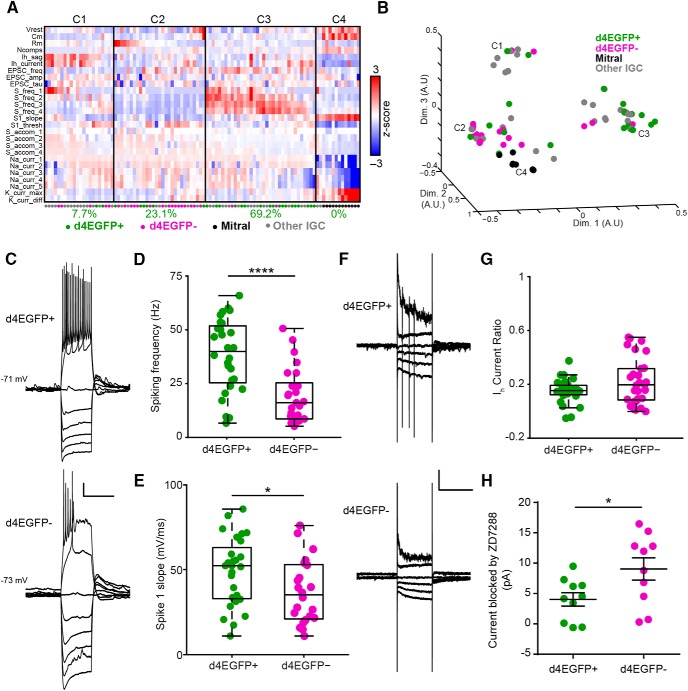
Arc-expressing IGCs are intrinsically more excitable than nonexpressing IGCs. A, Colorized heat map representation of 26 intrinsic descriptors (rows) across 100 AOB neurons (columns) that were subjected to current-clamp and voltage-clamp challenges. Solid vertical lines indicate divisions between identified clusters. Below each cluster is the percentage of all d4EGFP+ IGCs within that cluster. B, Multidimensional scaling of relative differences across all 26 dimensions from A into three dimensions. Each individual colored point indicates a cell, and C1–C4 refer to the cluster definitions in A. For A and B: d4EGFP+ IGCs, n = 26; d4EGFP− IGCs, n = 23; n = 15 animals; other IGCs, n = 39; mitral, n = 12; n = 37 animals. C, Sample traces for d4EGFP+ and d4EGFP− IGCs for current-clamp ramp challenges. Calibration: 10 mV, 500 ms. D, d4EGFP+ IGCs exhibit significantly increased spiking frequency when depolarized by a current injection (d4EGFP+, n = 26; d4EGFP−, n = 23; Wilcoxon–Mann–Whitney test, p < 0.0001). E, d4EGFP+ and d4EGFP− IGCs demonstrate increased maximal action potential slope (d4EGFP+, n = 26; d4EGFP−, n = 23; Wilcoxon–Mann–Whitney test, p < 0.05). F, Sample traces for d4EGFP+ and d4EGFP− IGCs for voltage-clamp ramp challenges. Traces displayed show responses to being held at −100, −90, −80, −70, −40, and −20 mV. Calibration: 50 pA, 500 ms. G, IH current ratio for d4EGFP+ and d4EGFP− cells (d4EGFP+, n = 26; d4EGFP−, n = 23; Wilcoxon–Mann–Whitney test, p = 0.24). H, IH subtracted currents following 10 μm ZD7288 application for d4EGFP+ and d4EGFP− IGCs (d4EGFP+ cells, n = 10; d4EGFP− cells, n = 10; n = 9 mice; Wilcoxon–Mann–Whitney test, p < 0.05). *p < 0.05, ****p < 0.0001.

